AWS에 직접 따라하면서 배울 수 있는 document를 제공하는 것을 알게되었다.
그래서 그 중 하나를 선택해서 직접 따라해보고 정리해보았다!
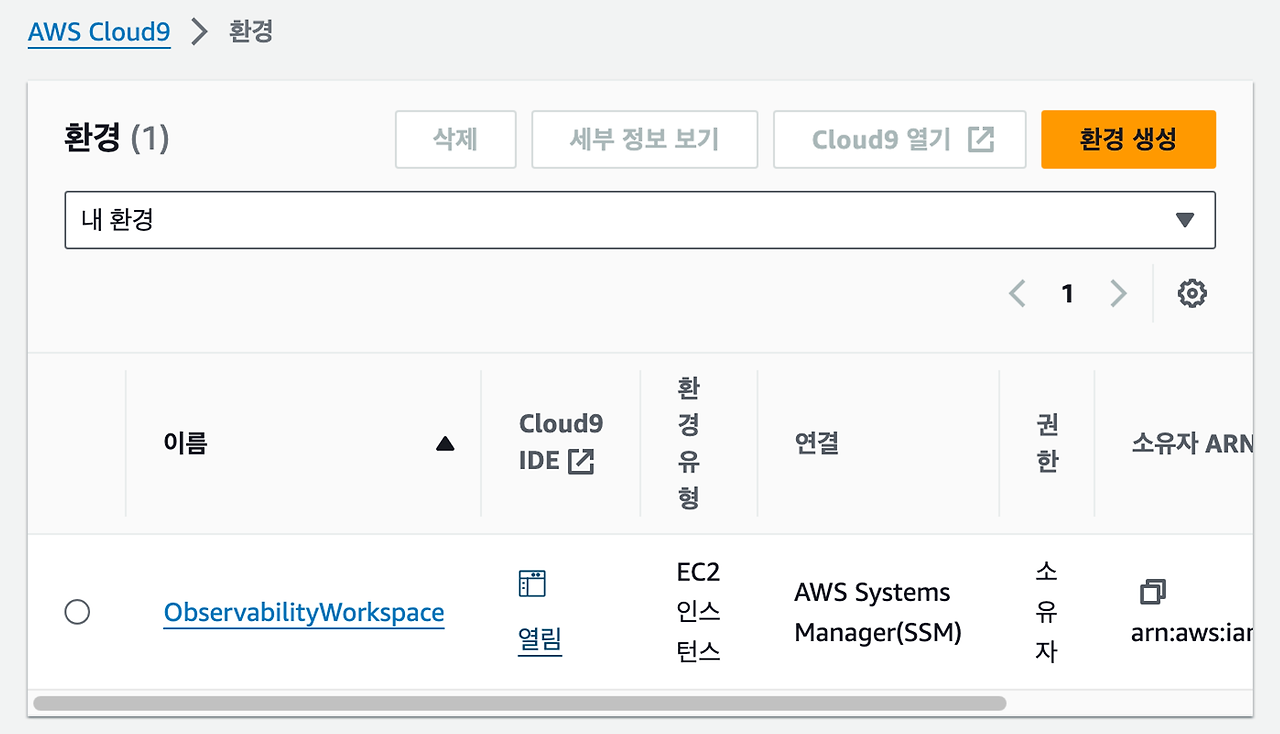
내가 선택한 것은 AWS Serverless Observability Workshop이다.
다른 흥미로운 것들도 많았지만 Observability에 관심이 많아져서
AWS에서 하는 Observability가 궁금해 선택하였다.
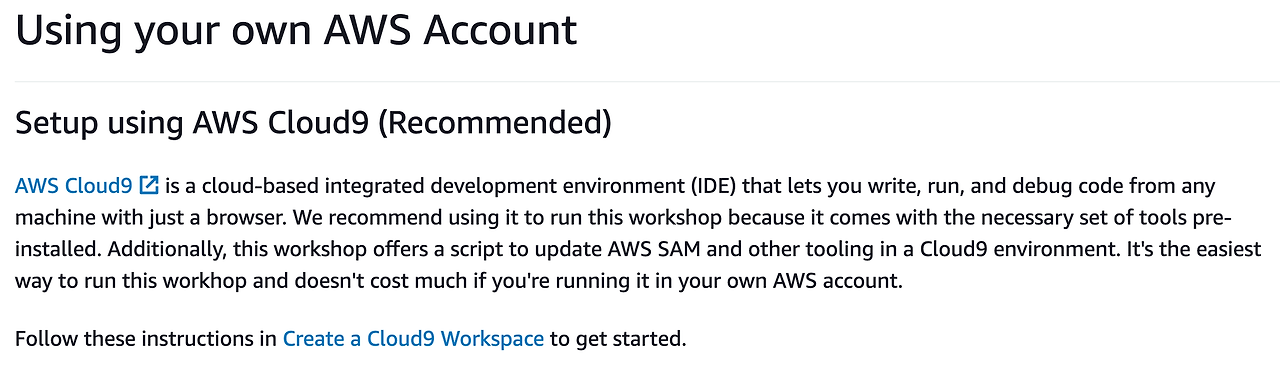
AWS Serverless Observability Workshop
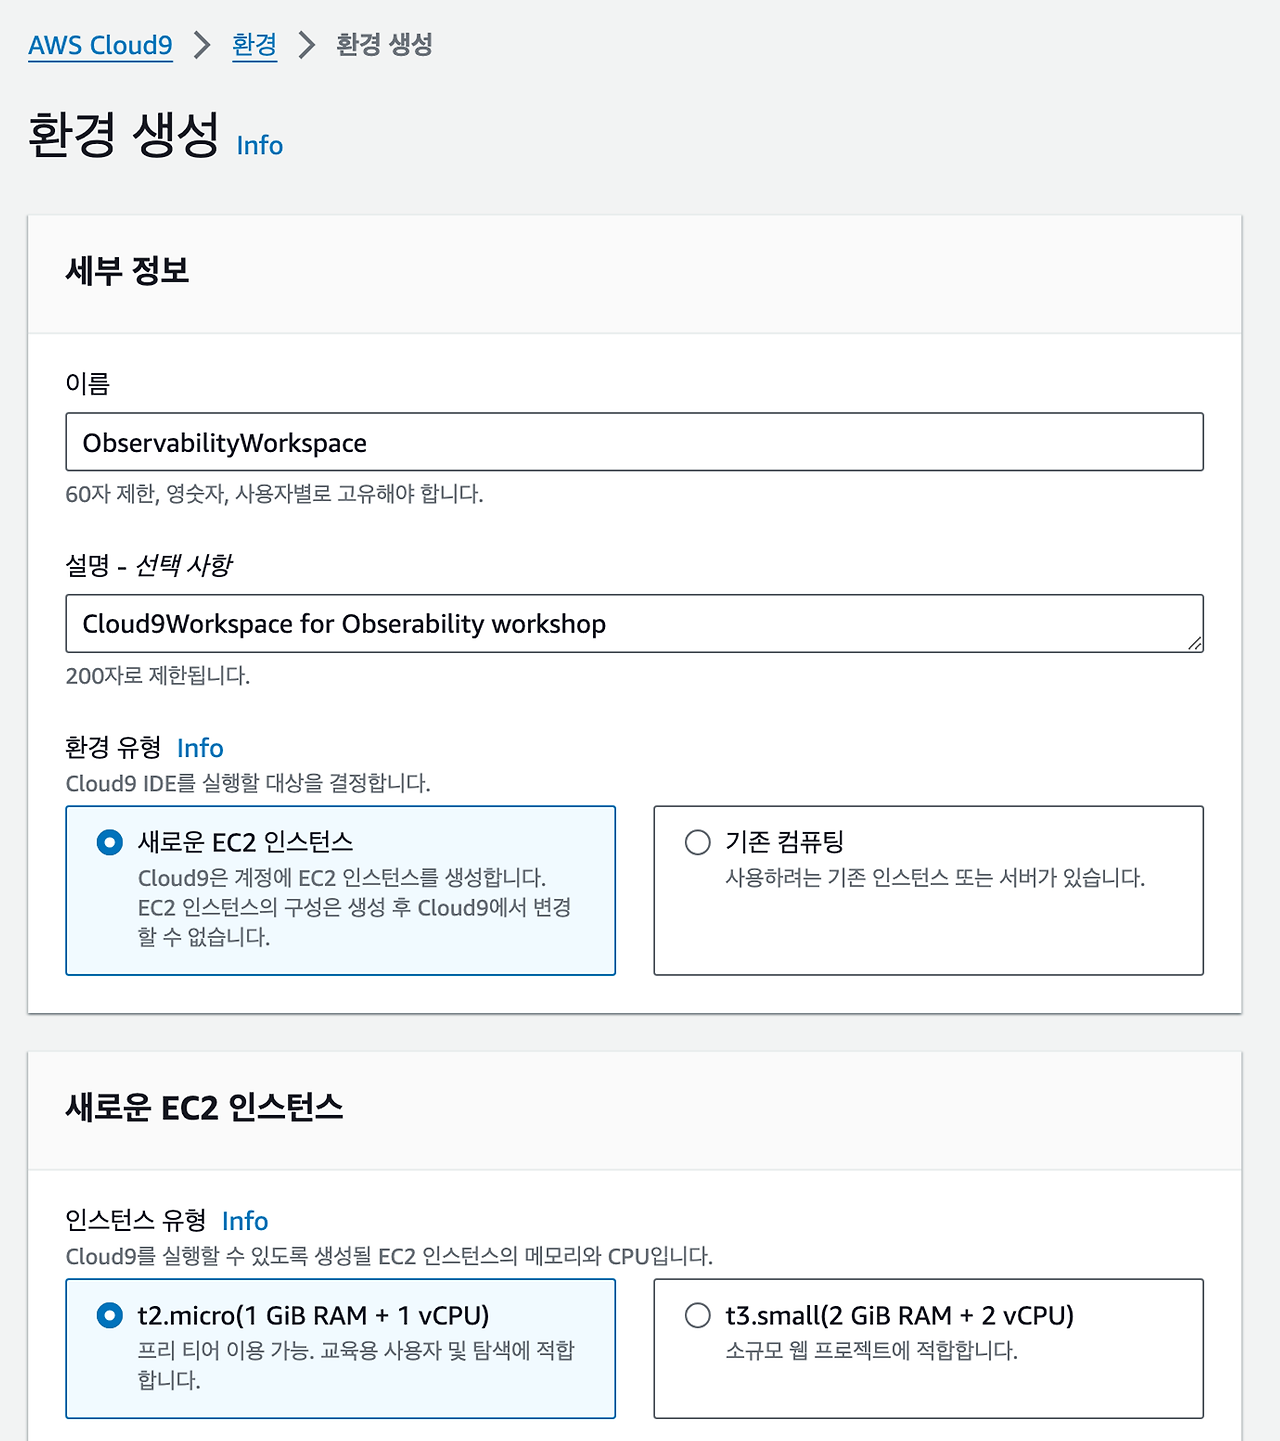
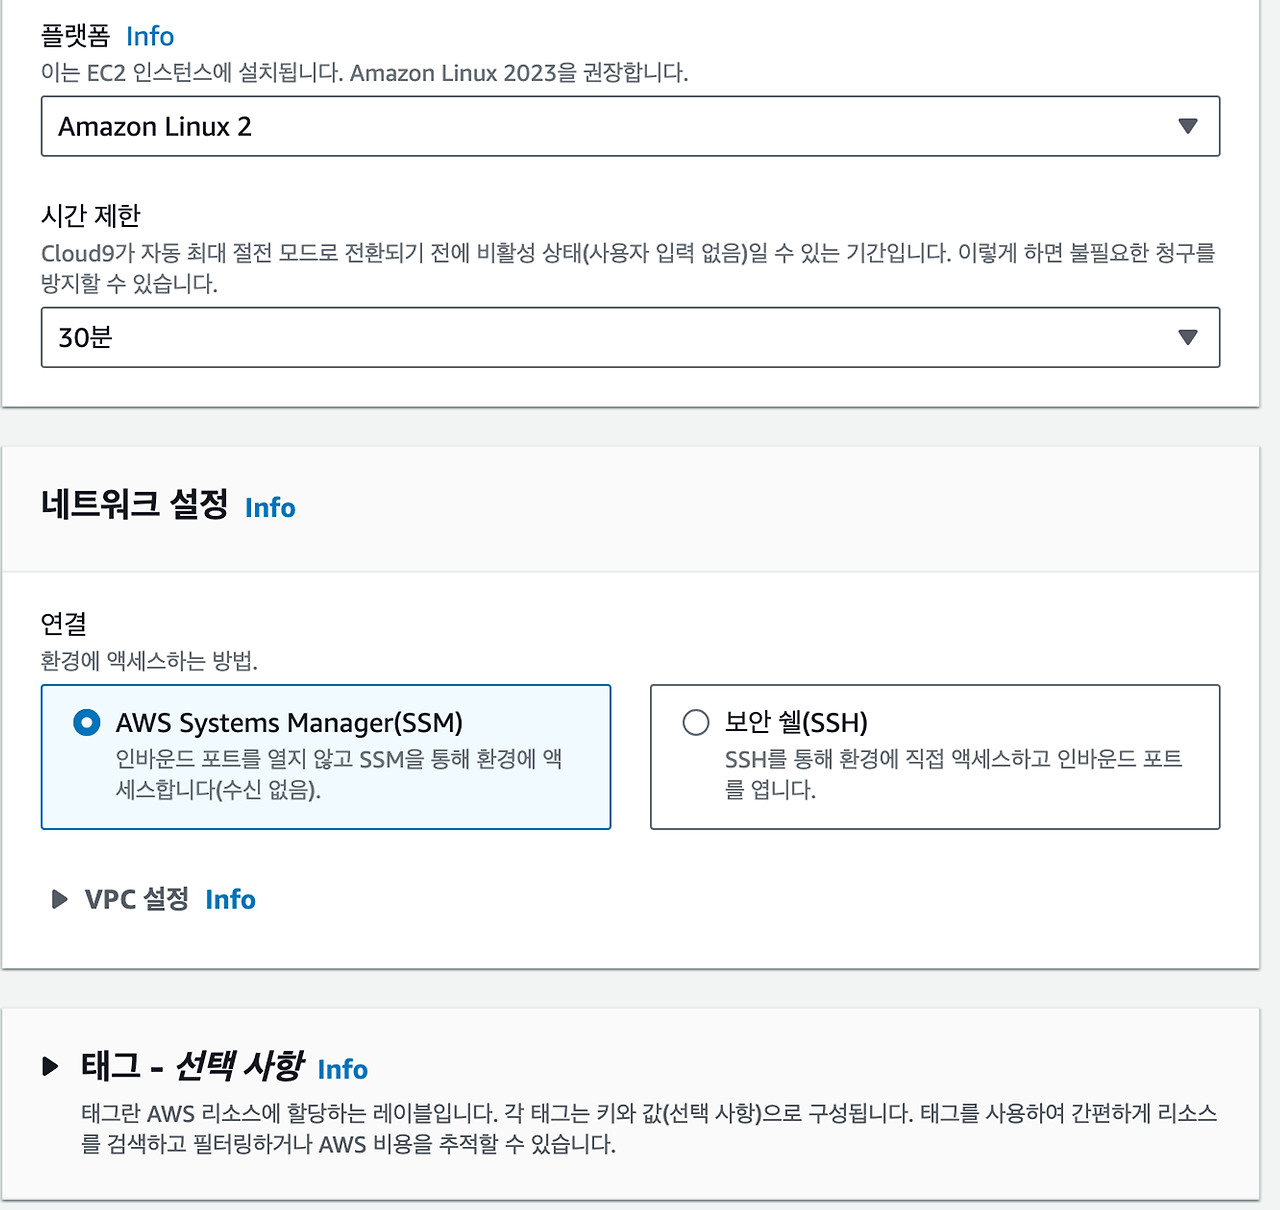
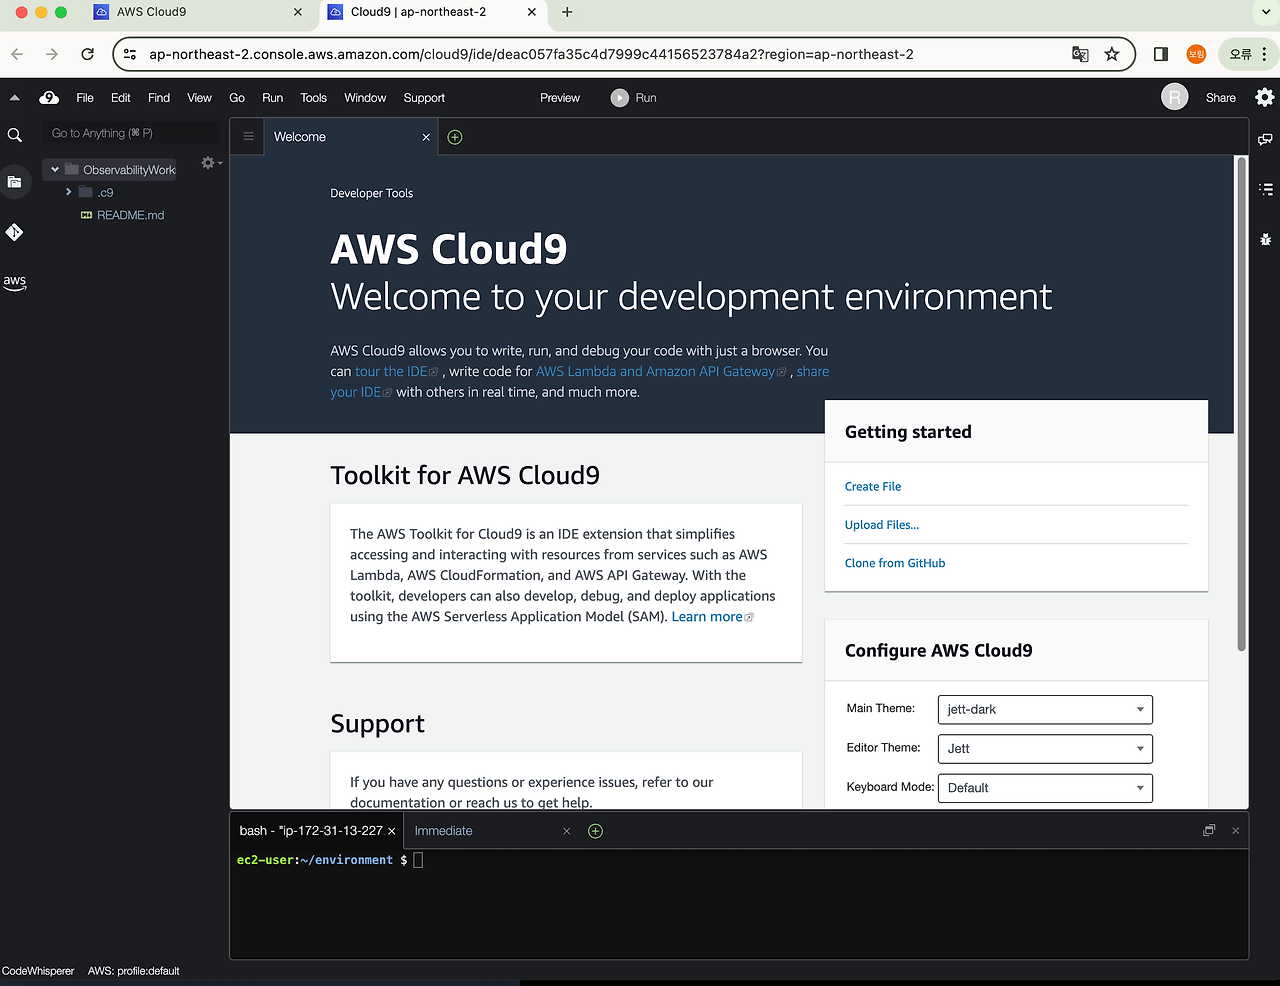
Set up
nvm install --lts=Gallium
sudo yum -y install jq
sudo pip3 install locustexport ACCOUNT_ID=$(aws sts get-caller-identity --output text --query Account)
export AWS_REGION=$(curl -s 169.254.169.254/latest/dynamic/instance-identity/document | jq -r '.region')
test -n "$AWS_REGION" && echo AWS_REGION is "$AWS_REGION" || echo AWS_REGION is not setecho "export ACCOUNT_ID=${ACCOUNT_ID}" | tee -a ~/.bash_profile
echo "export AWS_REGION=${AWS_REGION}" | tee -a ~/.bash_profile
aws configure set default.region ${AWS_REGION}
aws configure get default.regionDeploy the sample app
cd ~/environment
git clone https://github.com/aws-samples/serverless-observability-workshop.git
cd serverless-observability-workshop/code/sample-app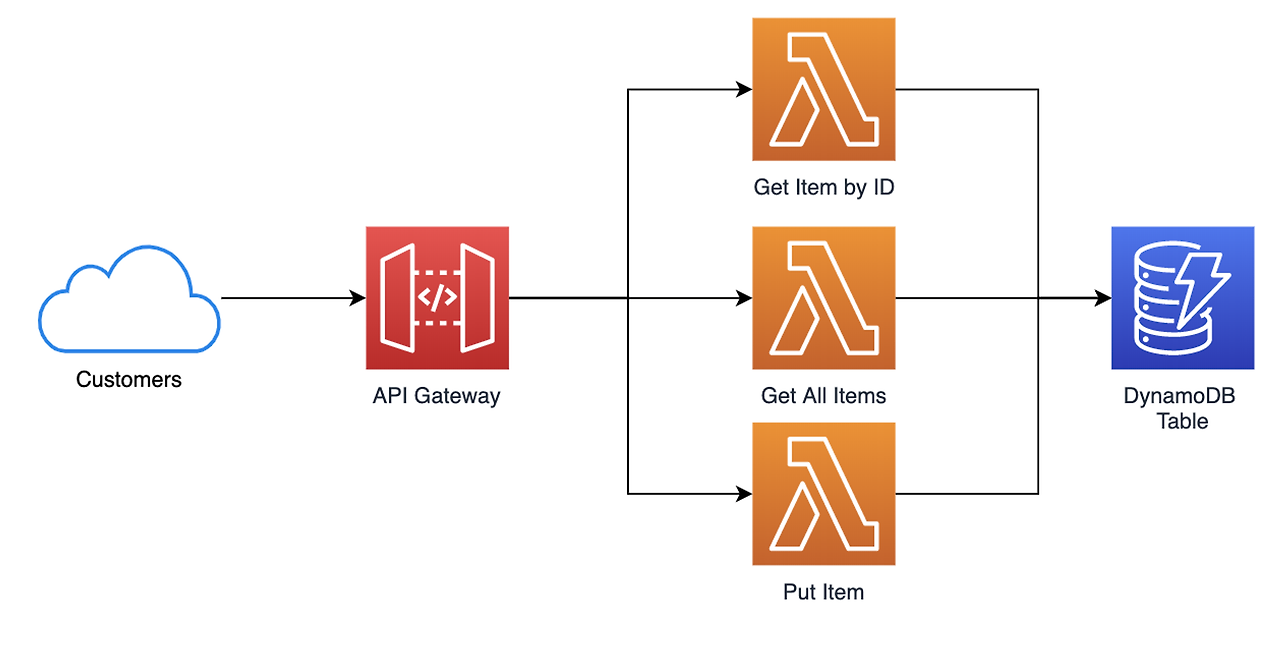
# Install, Build and Deploy the application
cd ~/environment/serverless-observability-workshop/code/sample-app
npm install
sam build
sam deploy -g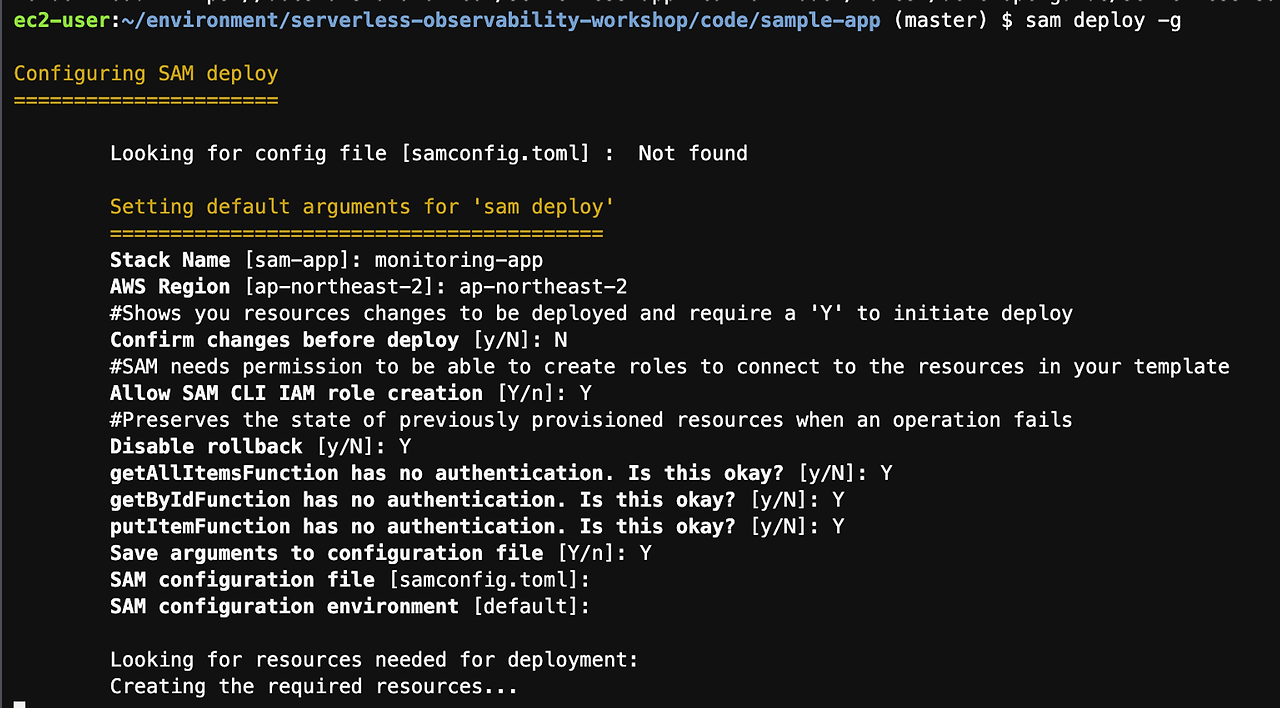
export ApiUrl=$(aws cloudformation describe-stacks --stack-name monitoring-app --output json | jq '.Stacks[].Outputs[] | select(.OutputKey=="ApiUrl") | .OutputValue' | sed -e 's/^"//'  -e 's/"$//')
echo "export ApiUrl="$ApiUrl
curl -X POST \
$ApiUrl/items/ \
-d '{
"id":"1",
"name": "Sample test item"
}'
curl -X POST \
$ApiUrl/items/ \
-d '{
"id":"2",
"name": "Second test item"
}'curl -X GET $ApiUrl/items/ | jq
curl -X GET $ApiUrl/items/1 | jq
Metrics and Dashboards
- metrix
- 사용자 지정 비즈니스 및 운영 지표를 CloudWatch에 푸시
- 서비스 중단 시 SRE/SysOps 엔지니어에게 알리기 위해 오류 지표를 기반으로 경보 생성
- 기본적으로 여러 서비스는 리소스에 대한 무료 지표를 제공 (예: Amazon EC2 인스턴스, Amazon EBS 볼륨 및 Amazon RDS DB 인스턴스)
- Amazon EC2 인스턴스와 같은 일부 리소스에 대한 세부 모니터링을 활성화
- 자체 애플리케이션 지표를 게시
- 검색, 그래프 작성 및 경보를 위해 계정의 모든 지표를 로드
- 대시보드에 경보를 추가하고 시각적으로 모니터링
- 경보는 지속적인 상태 변경에 대해서만 작업을 호출
- 단일 보기에서 리소스를 모니터링하는 데 사용할 수 있는 CloudWatch 콘솔의 사용자 지정 가능한 홈 페이지
도우미 함수 분석
미터법 단위 (데이터 정의)
- CloudWatch 지표에 지표를 푸시할 때 CloudWatch가 데이터를 적절하게 집계하려면 지표 단위를 정의해야 함
- /serverless-observability-workshop/code/sample-app/src/lib/helper/models.js 에 있는 Enum은 CloudWatch 지표에서 허용하는 가능한 단위 옵션의 전체 목록을 제공함
- /serverless-observability-workshop/code/sample-app/src/lib/helper/models.js 보기
/**
   * Enum CloudWatch Metric unit.
   * @readonly
   * @enum {String}
   */
  exports.MetricUnit = Object.freeze({
    Seconds: 'Seconds',
    Microseconds: 'Microseconds',
    Milliseconds: 'Milliseconds',
    Bytes: 'Bytes',
    Kilobytes: 'Kilobytes',
    Megabytes: 'Megabytes',
    Gigabytes: 'Gigabytes',
    Terabytes: 'Terabytes',
    Bits: 'Bits',
    Kilobits: 'Kilobits',
    Megabits: 'Megabits',
    Gigabits: 'Gigabits',
    Terabits: 'Terabits',
    Percent: 'Percent',
    Count: 'Count',
    BytesPerSecond: 'Second',
    KilobytesPerSecond: 'Second',
    MegabytesPerSecond: 'Second',
    GigabytesPerSecond: 'Second',
    TerabytesPerSecond: 'Second',
    BitsPerSecond: 'Second',
    KilobitsPerSecond: 'Second',
    MegabitsPerSecond: 'Second',
    GigabitsPerSecond: 'Second',
    TerabitsPerSecond: 'Second',
    CountPerSecond: 'Second'
  })
- CloudWatch 지표로 푸시 (원하는 로그 기록)
-
방법 동기식 메트릭 푸시 비동기식 메트릭 푸시 EMF(Embedded Metric Format) 설명 AWS SDK의 putMetricData() 메서드를 사용하여 CloudWatch에 사용자 정의 지표를 직접 푸시합니다. CloudWatch Logs에 로깅한 후, 로그를 처리하여 CloudWatch 지표로 비동기적으로 푸시합니다. 로그 데이터와 함께 사용자 정의 지표를 CloudWatch 로그에 기록합니다. CloudWatch는 자동으로 지표로 변환합니다. 성능 영향 성능과 실행 시간에 영향을 줄 수 있습니다. 백그라운드에서 실행되며, 함수의 실행 시간에 영향을 미치지 않습니다. 백그라운드에서 실행되며 성능에 미치는 영향이 거의 없습니다. 사용 시나리오 즉각적인 메트릭 업데이트가 필요한 경우에 적합합니다. 하지만 성능에 민감한 애플리케이션에서는 사용을 권장하지 않습니다. 로그 데이터를 기반으로 메트릭을 생성하고 싶을 때 사용하며, 실시간 데이터가 필요하지 않은 경우에 적합합니다. 비용 효율적인 메트릭 생성이 필요하거나, 로그 데이터와 메트릭을 동시에 분석하고 싶을 때 사용합니다. 비용 메트릭 당 비용이 발생합니다. 로그 데이터 처리 비용과 메트릭 생성 비용이 발생합니다. 쿼리 실행 비용만 발생하며, 지표 생성에는 추가 비용이 없습니다. - /serverless-observability-workshop/code/sample-app/src/lib/logging/logger.js 의 역할
- 지표를 동기식으로 푸시
- AWS SDK의 putMetricData() 메서드를 동기적으로 호출하여 CloudWatch에 사용자 정의 지표를 직접 푸시
- 성능과 실행 시간에 영향을 줄 수 있기 때문에, 성능에 민감한 애플리케이션에서는 비추천
- 지표를 비동기식으로 푸시
- CloudWatch Logs에 로깅한 후, CloudWatch Logs의 subscription filters를 사용하여 이 로그를 처리하고 CloudWatch 지표로 비동기적으로 푸시
- 로그 항목을 StatsD 형식의 JSON 객체로 기록하고, 이 데이터를 logMetric() 메서드를 사용하여 CloudWatch Logs에 기록
- 백그라운드에서 실행되며, 함수의 실행 시간에 영향을 미치지 않음
- EMF(Embedded Metric Format)를 사용하여 메트릭 푸시
- 사용자 정의 지표를 게시하는 보다 효율적이고 비용 효과적인 방법을 제공
- 로그 데이터와 함께 사용자 정의 지표를 CloudWatch 로그에 기록할 수 있으며, CloudWatch는 자동으로 추출하여 지표로 변환
- CloudWatch Logs Insights를 통해 쿼리할 수 있으며, 지표 생성 비용이 아닌 쿼리 실행 비용만 발생
- 지표를 동기식으로 푸시
- 지표를 동기식으로 푸시
- /serverless-observability-workshop/code/sample-app/src/lib/logging/logger.js 의 역할
동기식 전송 vs 비동기식 전송
→ 동기식으로 전송 할 경우 성능에 영향을 끼칠 수 있어 비동기식이 좋다.
/serverless-observability-workshop/code/sample-app/src/lib/logging/logger.js file에 사용자 정의 동기식 & 비동기식으로 메트릭 전송하는 함수가 있다.
AWS의 EMF(CloudWatch Embedded Metrics Format)를 이용하여 log들을 생성하고 CloudWatch에서 PutLogEvents API로 전송하면 더 비용 효율적이다.
/**
 * Logs Custom Metric on CloudWatch Metrics using Embedded Metric Format (EMF).
 *
 * @example
 * Logs metric to count the number of successful item retrievals using default dimensions and namespace.
 * logMetric(name = 'SuccessfulGetItem', unit = MetricUnit.Count, value = 1)
 * // Dimensions included: {service: 'service_undefined'}
 * // Namespace used: MonitoringApp
 *
 * @example
 * Logs metric to count the number of successful item retrievals per service & operation in the default namespace.
 * logMetric(name = 'SuccessfulGetItem', unit = MetricUnit.Count, value = 1, { service: 'item_service', operation: 'get-item-by-id' })
 * // Dimensions included: {service: 'item_service', operation: 'get-item-by-id'}
 * // Namespace used: MonitoringApp
 *
 * @example
 * Logs metric to count the number of successful item retrievals per service & operation in a custom namespace.
 * logMetric(name = 'SuccessfulGetItem', unit = MetricUnit.Count, value = 1, { service: 'item_service', operation: 'get-item-by-id', namespace: 'MySampleApp' })
 * // Dimensions included: {service: 'item_service', operation: 'get-item-by-id'}
 * // Namespace used: MySampleApp
 *
 * @property    {String}    AWS_EMF_NAMESPACE    Environment variable defining the service name to be used as metric namespace. This variable can be defined in the SAM template.
 *
 * @param   {String}        name    Metric name.
 * @param   {MetricUnit}    unit    Metric unit enum value (e.g. MetricUnit.Seconds). Metric units are available via Unit Enum. Default to Count.
 * @param   {Number}        value   Metric value. Default to 0.
 * @param   {Object}        dimensions Dict containing metric dimensions and namespace. Optional. (e.g. {customer: customerId})
 */
exports.logMetricEMF = async (name, unit = Unit.Count, value = 0, dimensions) => {
    try {
        const metrics = createMetricsLogger()
        metrics.putDimensions(buildEMFDimensions(dimensions))
        metrics.putMetric(name, value, unit)
        metrics.setNamespace(process.env.AWS_EMF_NAMESPACE !== undefined ? process.env.AWS_EMF_NAMESPACE : 'aws-embedded-metrics')
        log.debug(`Logging custom metric ${name} via Embedded Metric Format (EMF)`)
        log.debug(metrics)
        await metrics.flush()
    } catch (err) {
        log.error({ operation: dimensions.operation !== undefined ? options.dimensions : 'undefined_operation', method: 'logMetricEMF', details: err })
        throw err
    }
}

/**
 * Transforms arguments into dimensions to EMF.
 *
 * @property    {String}        SERVICE_NAME    Environment variable defining the service name to be used as metric dimension. This variable can be defined in the SAM template.
 *
 * @param       {Object}        dimensions Dict containing metric dimensions and namespace. Optional. (e.g. {customer: customerId})
 *
 * @returns     {Object}        Custom Dimensions object.
 */
const buildEMFDimensions = (dimensions) => {
    let service = process.env.SERVICE_NAME !== undefined ? process.env.SERVICE_NAME : 'service_undefined'

    if (dimensions) {
        if (dimensions.service !== undefined) service = dimensions.service
        delete dimensions.namespace
        delete dimensions.service
    }

    return dimensions
}
Pushing Metrics Synchronously
Modifying the Application Code
메트릭 정의 & putMetric()함수로 CloudWatch에 push
Defining Metrics
Let's define the following Business & Operational metrics:
- ColdStart
- UnsupportedHTTPMethod
- SuccessfulPutItem
- FailedPutItem
Put Item 함수 변경
- /serverless-observability-workshop/code/sample-app/src/handlers/put-item.js
const AWS = require('aws-sdk')
const docClient = new AWS.DynamoDB.DocumentClient()
const { MetricUnit } = require('../lib/helper/models')
const { putMetric } = require('../lib/logging/logger')

let _cold_start = true- MetricUnit
- putMetric
- _cold_start

2. 첫 번째 실행인 ColdStart이면, putMetric 함수로 CloudWatch에 알리기
exports.putItemHandler = async (event, context) => {
    let response
    try {
        if (_cold_start) {
            //Metrics
            await putMetric(name = 'ColdStart', unit = MetricUnit.Count, value = 1, { service: 'item_service', function_name: context.functionName })
            _cold_start = false
        }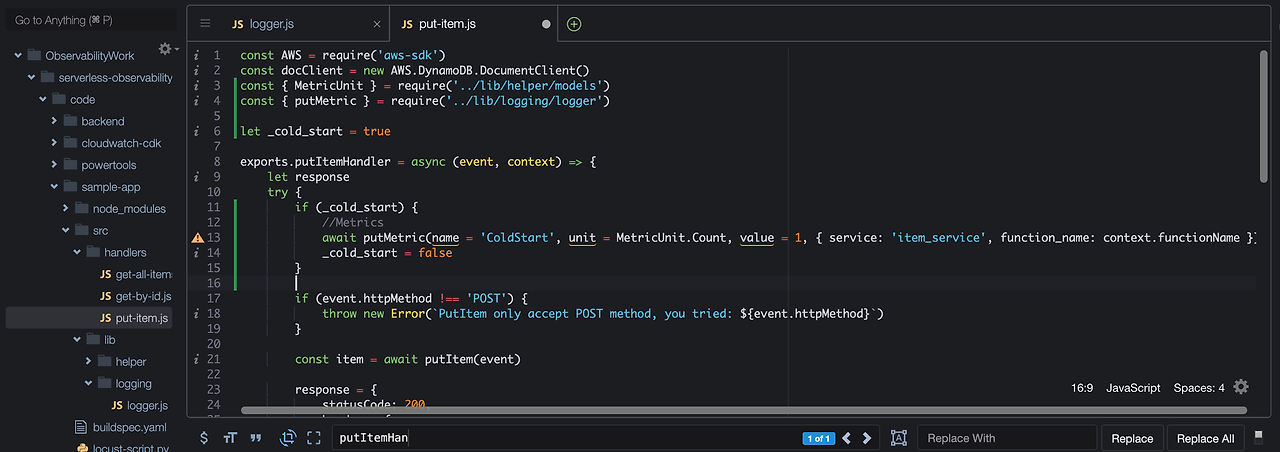
3. UnsupportedHTTPMethod 일 경우 알리기
    if (event.httpMethod !== 'POST') {
        await putMetric(name = 'UnsupportedHTTPMethod', unit = MetricUnit.Count, value = 1, { service: 'item_service', operation: 'put-item' })
        throw new Error(`PutItem only accept POST method, you tried: ${event.httpMethod}`)
    }
4. PutItem시 성공/실패 결과 알리기
    try{
        //After Sucessful Response Composition
        //Metrics
        await putMetric(name = 'SuccessfulPutItem', unit = MetricUnit.Count, value = 1, { service: 'item_service', operation: 'put-item' })
    } catch (err) {
        //After Exception Handling
        //Metrics
        await putMetric(name = 'FailedPutItem', unit = MetricUnit.Count, value = 1, { service: 'item_service', operation: 'put-item' })
    }
5. 저장 후 반영하기
cd ~/environment/serverless-observability-workshop/code/sample-app
sam build && sam deploy
Test the Application
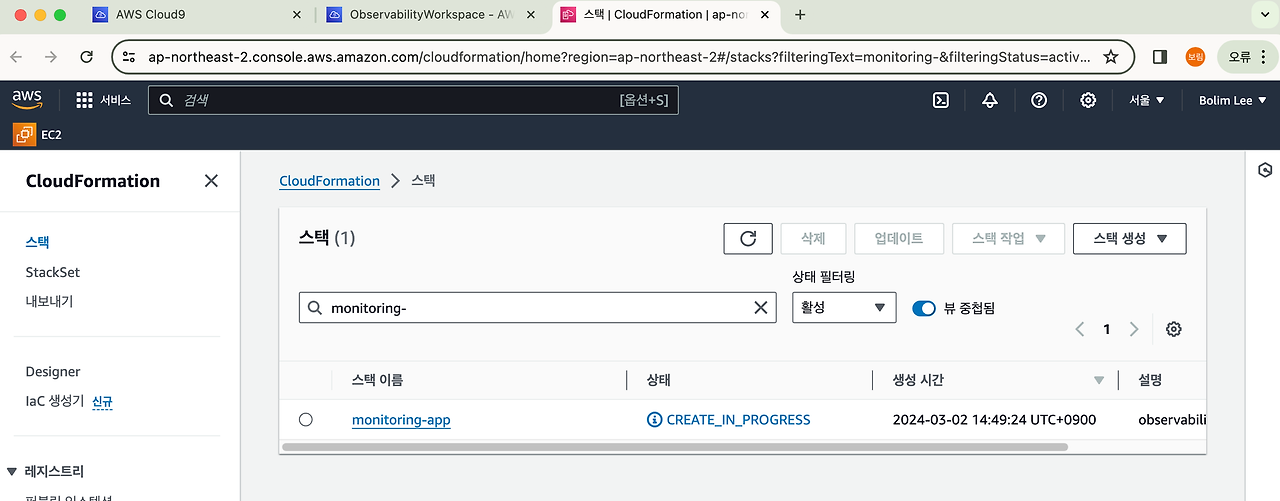
이제 API호출을 위해 CloudFormation Stack이 제공하는 ApiURL을 환경변수로 설정한다.
export ApiUrl=$(aws cloudformation describe-stacks --stack-name monitoring-app --output json | jq '.Stacks[].Outputs[] | select(.OutputKey=="ApiUrl") | .OutputValue' | sed -e 's/^"//'  -e 's/"$//')
echo "export ApiUrl="$ApiUrl
PutItem 테스트
curl -X POST \
  $ApiUrl/items/ \
  -d '{
        "id":"3",
        "name": "Sample third item"
  }'
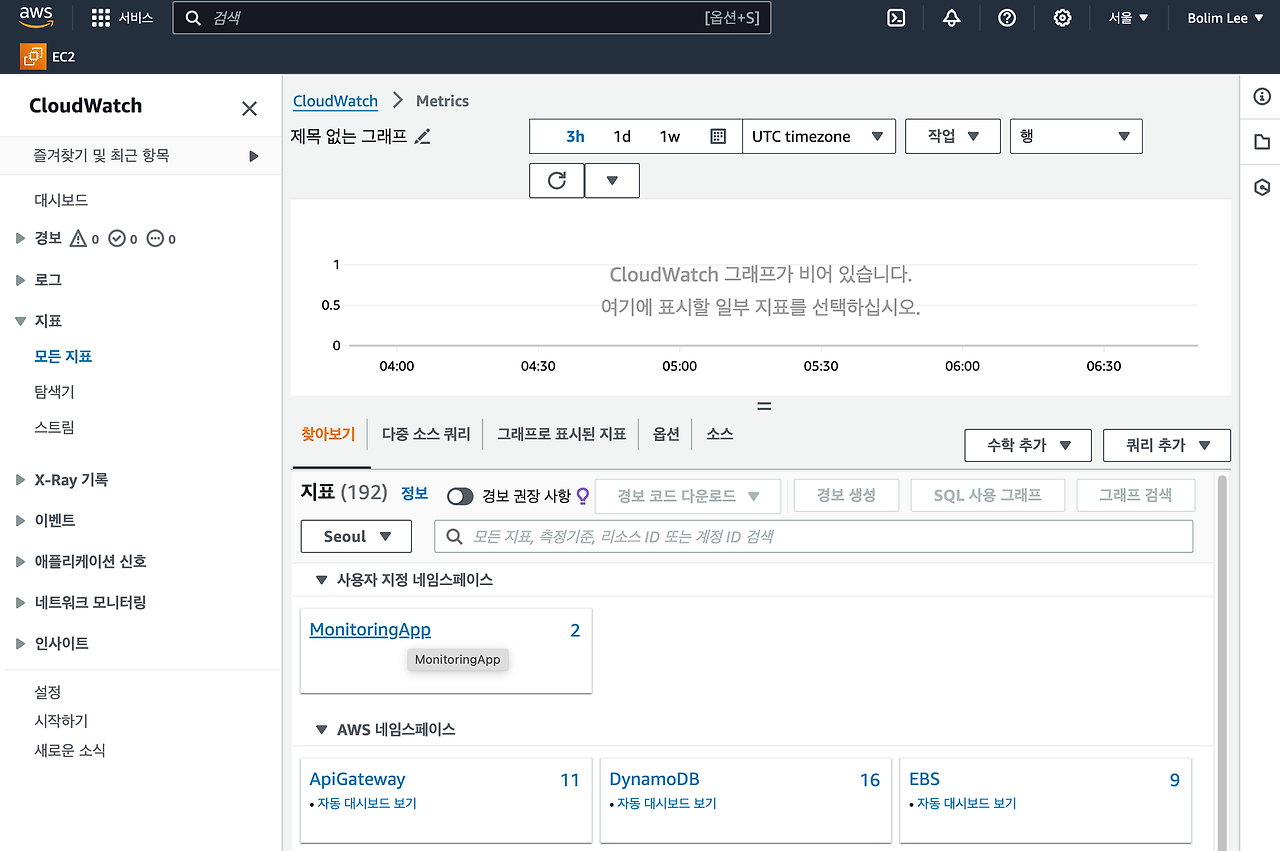
Validate Metrics in the Console
- CloudWatch(https://console.aws.amazon.com/cloudwatch/home) > 지표(Metrics) > 모든 지표(All metrics)에 들어가, MonitoringApp 클릭

2. function_name, service 에 들어가기

cold_start 정보와 호출한 함수 정보가 들어있다.
3. 다시 뒤로 돌아가 operation, service에 들어가기

이전에 호출한 putItem api에 대한 성공/실패 정보가 담겨있다.
4. 그래프로 표시된 지표(Graphed Metrics) 들어가기
- 우상단 행>번호 로 바꾸기
- 아래 Statistic에서 Sum으로 바꾸기
- 기간도 1Day로 수정하기
 내가 호출한 api에 대한 메트릭을 확인한다.
Async Metrics using Embedded Metrics Format (EMF)
이번에는 EMF를 이용하여 동기→비동기로 메트릭을 푸시한다.
EMF 소개
Modify the SAM Template
- serverless-observability-workshop/code/sample-app/template.yaml 파일 수정
- 모든 람다 함수에 Custom Metric Namespace 넣어주기
Globals:
Function:
    Runtime: nodejs12.x
    Timeout: 100
    MemorySize: 128
    CodeUri: ./
    Environment:
    Variables:
        APP_NAME: !Ref SampleTable
        SAMPLE_TABLE: !Ref SampleTable
        SERVICE_NAME: item_service
        ENABLE_DEBUG: false
        AWS_NODEJS_CONNECTION_REUSE_ENABLED: 1
        AWS_EMF_NAMESPACE: MonitoringApp # <----- ADD FOR NAMESPACE SETUP
Modify the GetAllItems Function
서비스 중 얻고 싶은 Metric을 위한 정의를 하는 단계이다.
logMetricEMF() 함수에 custom metric을 넣어 더 상세한 로그 이벤트 정보를 얻은 후, CloudWatch로 비동기적으로 보내고자 한다.
해당 과정으로 CloudWatch는 따로 컴포넌트 생성 없이 유지와 운영을 위한 custom metric들을 자동 추출한다.
Metrics
- ColdStart
- UnsupportedHTTPMethod
- SuccessfulGetAllItems
- FailedGetAllItems
- 람다 함수(/serverless-observability-workshop/code/sample-app/src/handlers/get-all-items.js ) 코드 수정하기
- dependency 추가
- Unit
- logMetricEMF
- cold start 변수 선언한다.
- dependency 추가
const AWS = require('aws-sdk')
const docClient = new AWS.DynamoDB.DocumentClient()
const { Unit } = require("aws-embedded-metrics");
const { logMetricEMF } = require('../lib/logging/logger')

let _cold_start = true
2. PutMetric 추가하기
- getAllItemsHandler()함수 안에 cold start(첫 번째 실행 여부) label을 설정하여 CloudWatch로 push(logMetricEMF()함수 사용)한다.
exports.getAllItemsHandler = async (event, context) => {
    let response
    try {
        if (_cold_start) {
            //Metrics
            await logMetricEMF(name = 'ColdStart', unit = Unit.Count, value = 1, { service: 'item_service', function_name: context.functionName })
            _cold_start = false
        }
3.UnsupportedHTTPMethod 를 알리기 위한 코드 수정하기
- getAllItemsHandler()함수 안에 logMetricEMF함수로 cloudWatch로 push하는 코드 추가한다.
    if (event.httpMethod !== 'GET') {
        await logMetricEMF(name = 'UnsupportedHTTPMethod', unit = Unit.Count, value = 1, { service: 'item_service', operation: 'get-all-items' })
        throw new Error(`getAllItems only accept GET method, you tried: ${event.httpMethod}`)
    }
4. 만든 api가 성공적으로 호출 되었는지 여부를 알리기
- getAllItemsHandler() 함수 안에 코드 추가한다.
    try{
        //After Successful Response Composition
        //Metrics
        await logMetricEMF(name = 'SuccessfulGetAllItems', unit = Unit.Count, value = 1, { service: 'item_service', operation: 'get-all-items' })
    } catch (err) {
        //After Exception Handling
        //Metrics
        await logMetricEMF(name = 'FailedGetAllItems', unit = Unit.Count, value = 1, { service: 'item_service', operation: 'get-all-items' })
    }
Modify the GetItemByID Function
이번에도 이전과 비슷한 과정을 반복한다.
- /serverless-observability-workshop/code/sample-app/src/handlers/get-by-id.js 코드 수정하기
- dependencies 및 cold start 변수 추가
const AWS = require('aws-sdk')
const docClient = new AWS.DynamoDB.DocumentClient()
const { Unit } = require("aws-embedded-metrics");
const { logMetricEMF } = require('../lib/logging/logger')

let _cold_start = true
2. getByIdHandler() 함수에 Cold Start를 알리기 위한 코드 수정
exports.getByIdHandler = async (event, context) => {
    let response, id
    try {
        if (_cold_start) {
            //Metrics
            await logMetricEMF(name = 'ColdStart', unit = Unit.Count, value = 1, { service: 'item_service', function_name: context.functionName })
            _cold_start = false
        }
3. UnsupportedHTTPMethod 가 호출되었음을 알리기 위한 코드를 추가하기
    if (event.httpMethod !== 'GET') {
        await logMetricEMF(name = 'UnsupportedHTTPMethod', unit = Unit.Count, value = 1, { service: 'item_service', operation: 'get-by-id' })
        throw new Error(`getById only accept GET method, you tried: ${event.httpMethod}`)
    }
4. getByIdHandler()에서 함수 호출이 성공적으로 되었는 지의 여부를 알리는 코드 추가하기'
    try{
        //After Successful Response Composition
        //Metrics
        await logMetricEMF(name = 'SuccessfulGetItem', unit = Unit.Count, value = 1, { service: 'item_service', operation: 'get-by-id' })
    } catch (err) {
        //After Exception Handling
        //Metrics
        await logMetricEMF(name = 'FailedGetItem', unit = Unit.Count, value = 1, { service: 'item_service', operation: 'get-by-id' })
    }
Deploy & Validate Metrics in the Console
지금까지 해온 것을 반영한다.
cd ~/environment/serverless-observability-workshop/code/sample-app
sam build && sam deploy
CloudFormation으로 부터 데이터를 가져와 ApiUrl 환경변수를 만들어준다.
export ApiUrl=$(aws cloudformation describe-stacks --stack-name monitoring-app --output json | jq '.Stacks[].Outputs[] | select(.OutputKey=="ApiUrl") | .OutputValue' | sed -e 's/^"//'  -e 's/"$//')
echo "export ApiUrl="$ApiUrl
테스트 해보기
curl -X GET $ApiUrl/items/1 | jq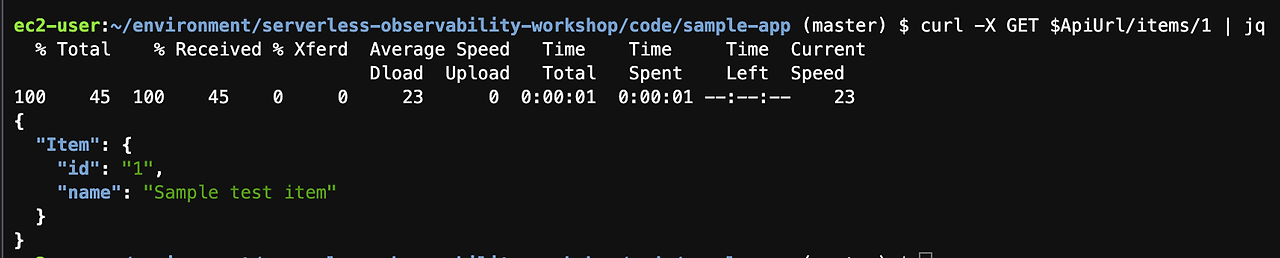
curl -X GET $ApiUrl/items/ | jq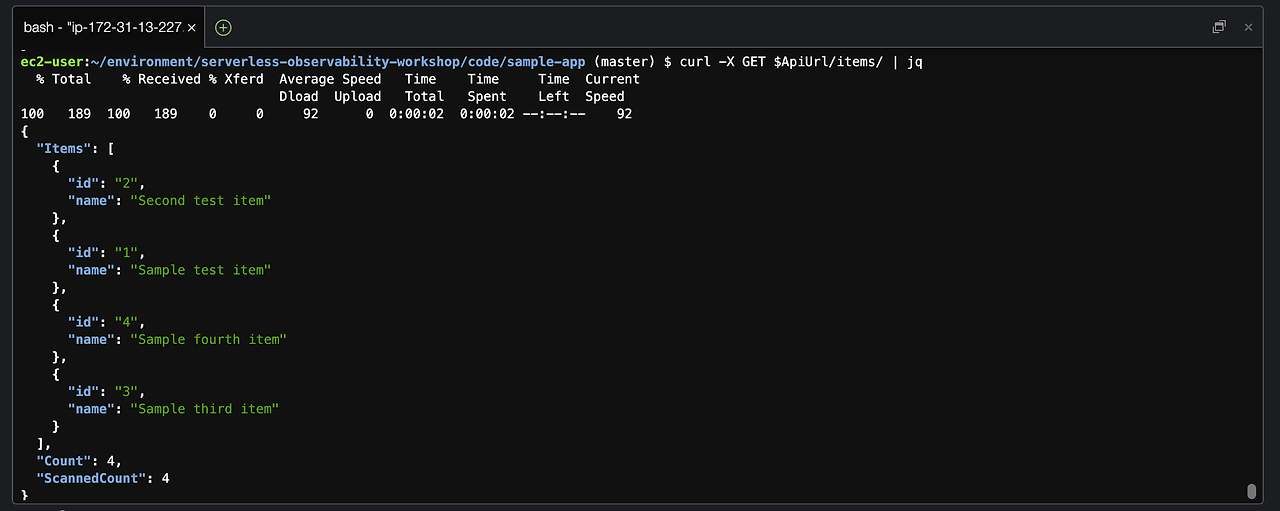
CloudWatch에서 확인해본다.
로그 확인
로그 > 로그 그룹 > 로그 스트림 > 로그 이벤트에서 확인 가능하다.
확장해서 살펴보면 이전 코드에서 인자로 넣어주었던 name, unit, ServiceName, operation등을 확인할 수 있다.
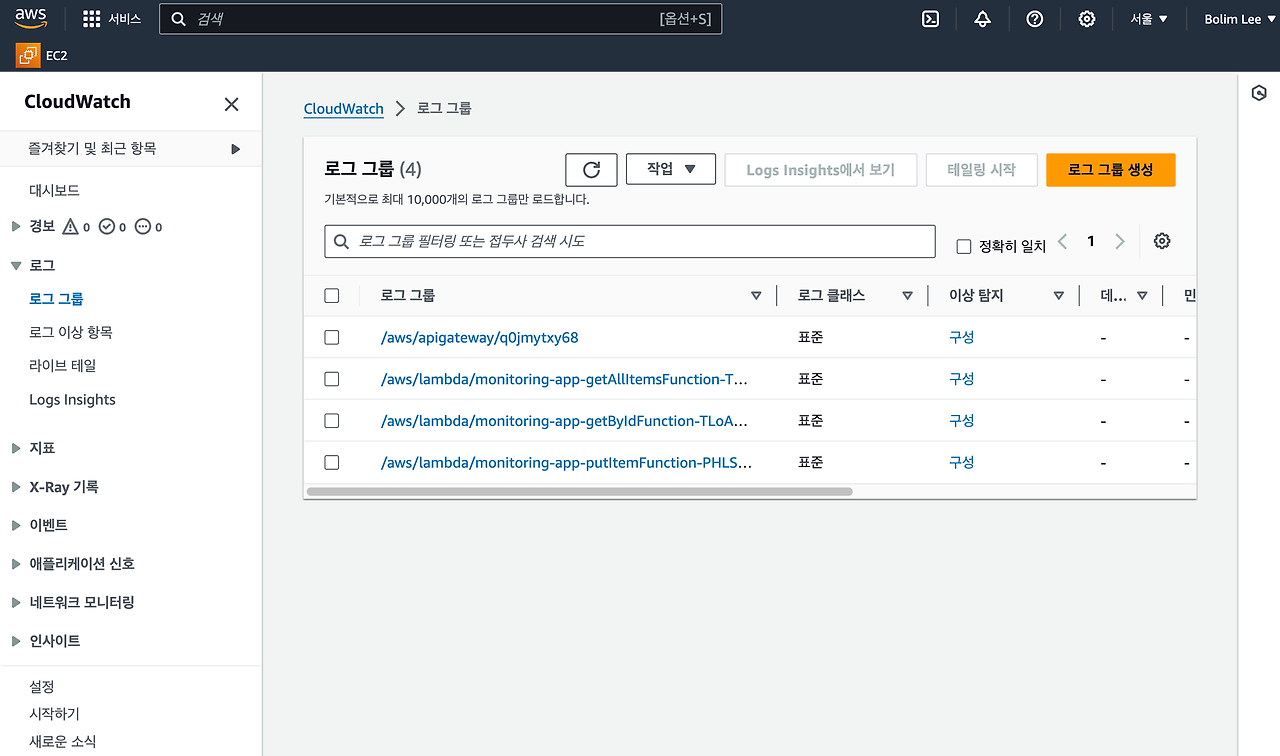
메트릭 확인
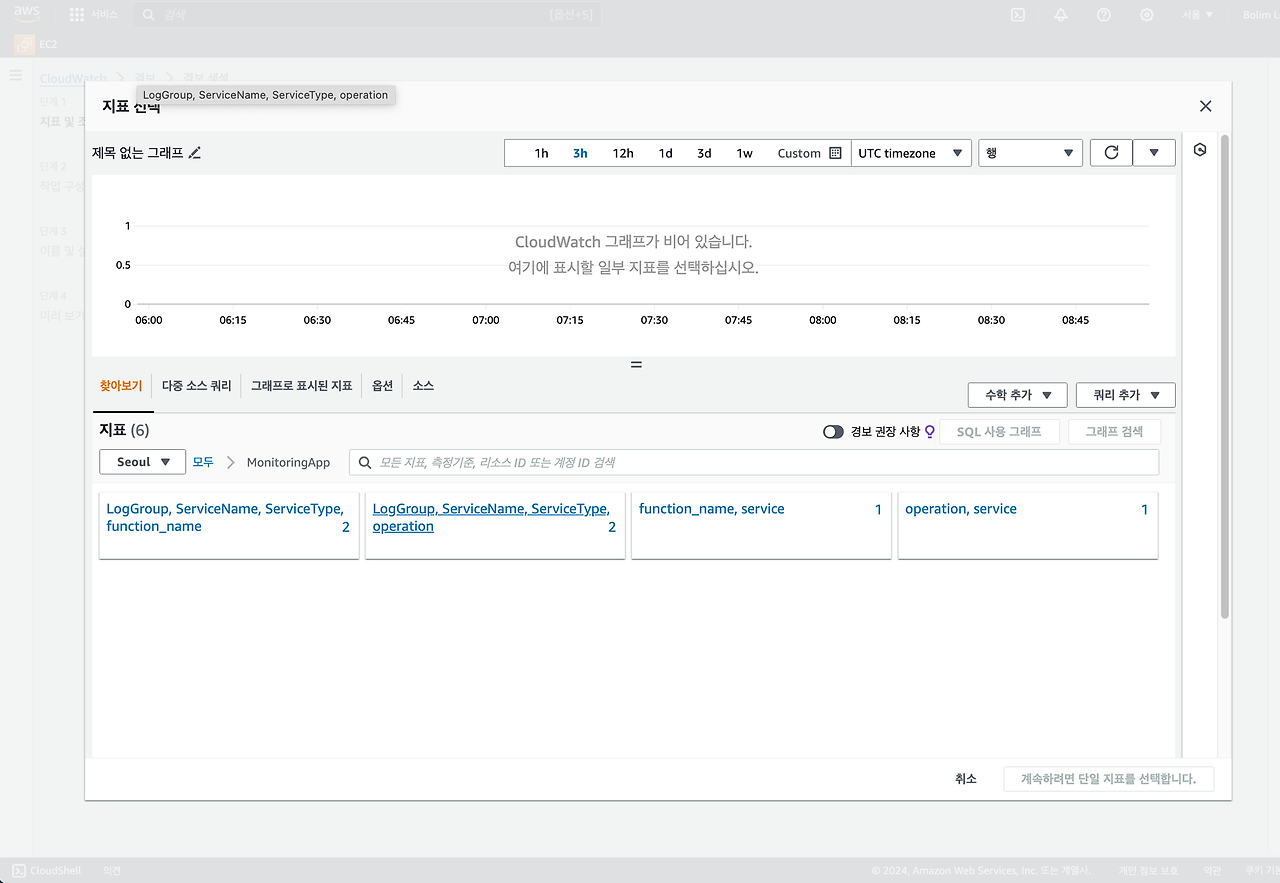
지표 > 모든 지표 > MonitoringApp namespace > LogGroup, ServiceName, ServiceType, function_name 을 들어가 확인한다.

이전에 보낸 인자에서 ServiceType이 달라짐에 따라 다르게 분류된 것도 확인할 수 있다.


LogGroup, ServiceName, ServiceType, operation 을 들어가 확인한다.

여기서 그래프로 표시된 지표로 들어간다.
우측 상단, 행 > 번호 로 변경한다.
지표들의 통계를 합계로 변경한다.
이렇게 메트릭을 보기쉽게 그래프를 바꿀 수 있다.

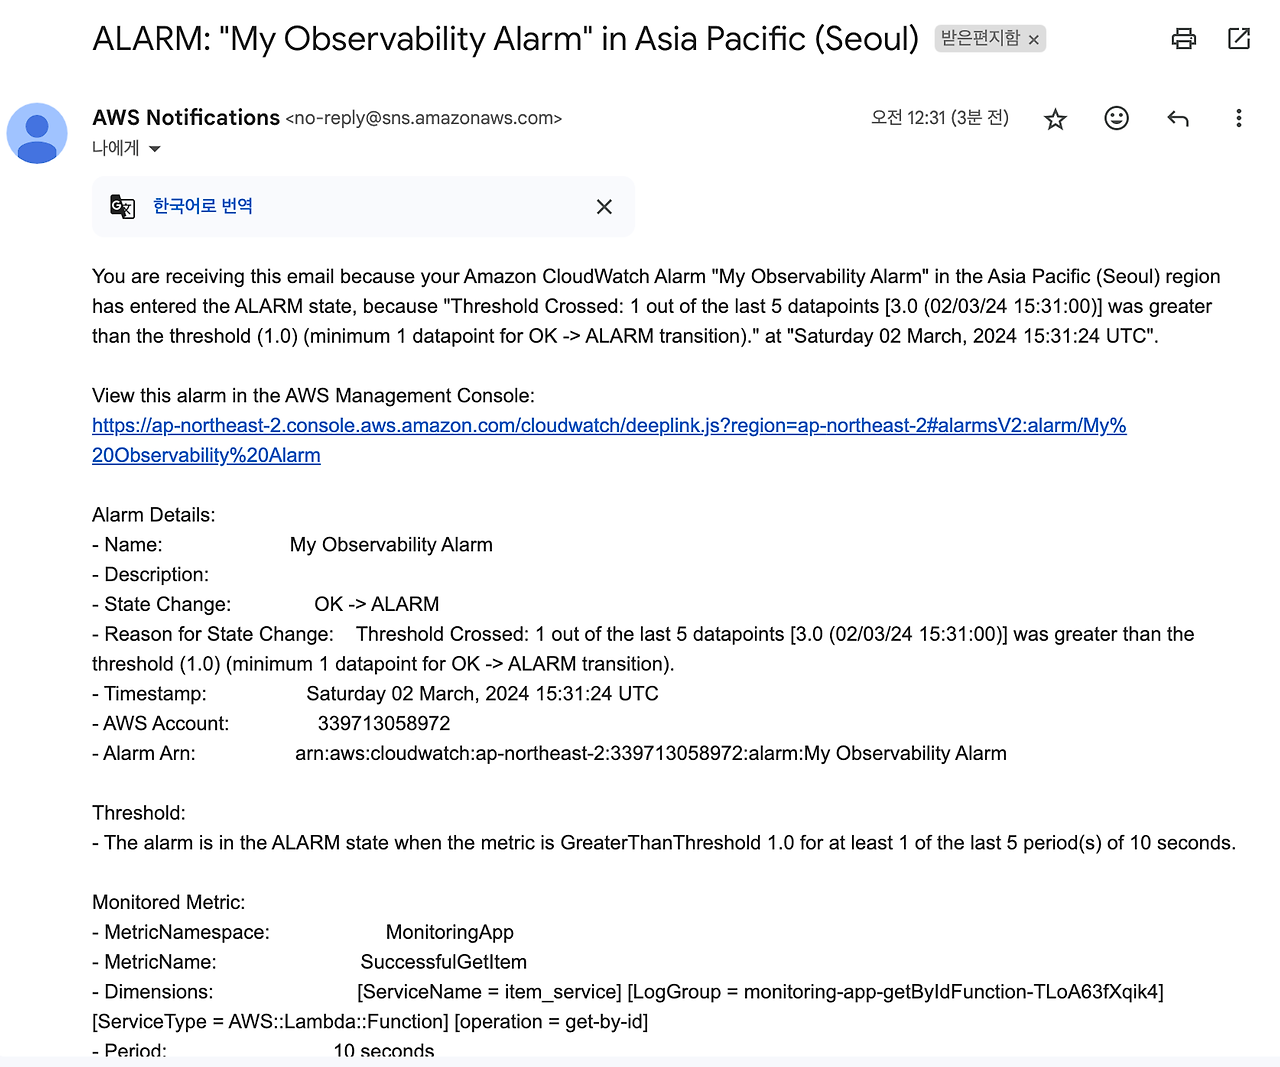
Alarms
Create a Metric Alarms
- CloudWatch Alarm Console(https://console.aws.amazon.com/cloudwatch/home?#alarmsV2:)로 이동
- 알람 생성 클릭

- 알람 생성 클릭
2. 지표 선택

3. MonitoringApp > LogGroup, ServiceName, ServiceType, operation > getbyitems의 SuccessfulGetItems 선택
4. 통계 : 합계 로 수정 (기간을 줄이면 더 빠르게 확인 가능)

5. 임계값 수정(정적 & 보다 큼 - 1 out of 5)

6. 알림
- 경보상태
- SNS - 새 주제 생성 & 주제 이름 설정 & 수신할 이메일 입력
- 주제 생성 클릭

7.이름 및 설명 추가
- 이름만 My Observability Alarm으로 설정

- 계속 다음 클릭
- 이렇게 경보를 생성하면, SNS에 넣은 이메일로 메일이 온다.
- Confirm subscription 클릭


Triggering An Alarm
다시 Cloud9으로 돌아가 API를 호출해본다.
- ApiUrl 환경변수가 없어졌으면 다시 설정한다.
export ApiUrl=$(aws cloudformation describe-stacks --stack-name monitoring-app --output json | jq '.Stacks[].Outputs[] | select(.OutputKey=="ApiUrl") | .OutputValue' | sed -e 's/^"//'  -e 's/"$//')
echo "export ApiUrl="$ApiUrl
2. api 호출을 한 번 해보고 5분을 기다리면 데이터 부족 상태 > 정상 으로 바뀐다.
curl -X GET $ApiUrl/items/1 | jq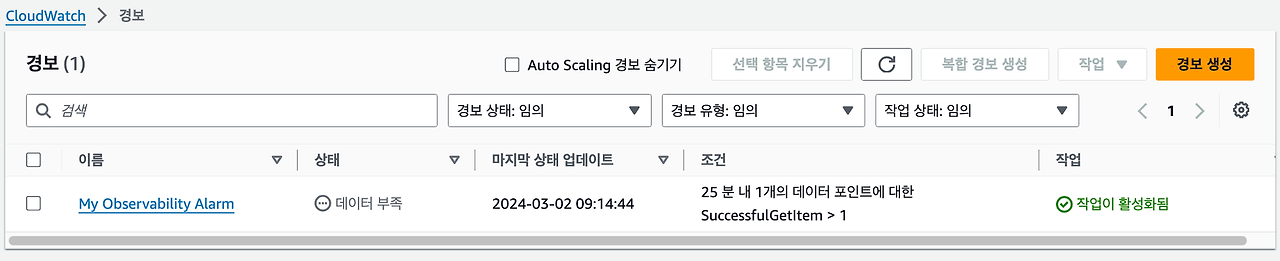

3. 경보를 발생시키고 수신 받은 이메일을 확인한다.

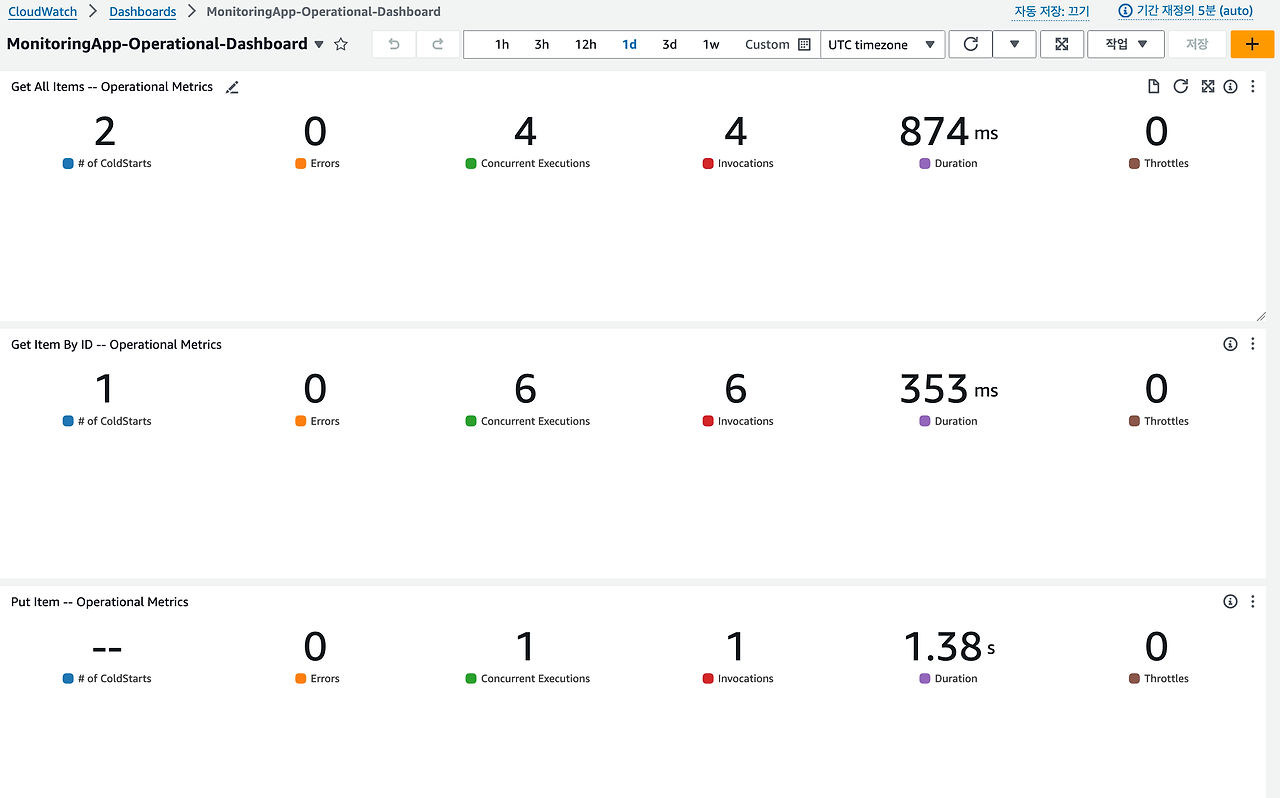
Creating Dashboards
자동화된 유연하고 재사용 가능한 대시보드를 만들기 위해서는 CDK template 배포과정이 필요하다.
이를 위한 설치 및 배포 과정이다.
# Install, Build and Deploy the application
cd ~/environment/serverless-observability-workshop/code/cloudwatch-cdk
npm outdated
npm update --force
npm install --force
npm install -g typescript aws-cdk
cdk deploy -c stack_name=monitoring-app⚠️주의 - 위에서 no space left on device 에러가 발생했다면 아래 command를 실행하고 다시 시도하면 된다.
# Look for uninstallable node_modules in our workspace to free disk space
find ~/environment -type d -name 'node_modules' -prune | xargs rm -r
⚠️주의 - JS heap out of memory 문제가 발생할 수 있다. t2.micro 메모리(1024)가 부족해서 뜨는 에러이기 때문에 t2.small 로 ec2 인스턴스를 scale up하면 해결된다.
이제 CloudWatch Dashboard Console(https://console.aws.amazon.com/cloudwatch/home?#dashboards:)을 확인한다.


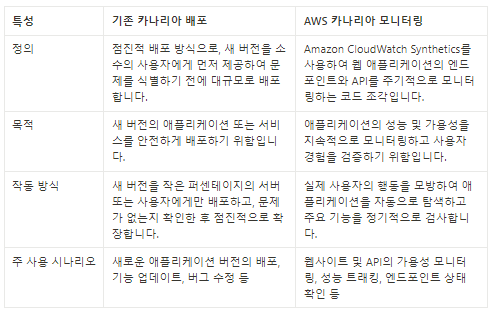
- 카나리아
- 카나리아는 실제 사용자의 경로와 작업을 모방하여 애플리케이션의 고객 경험을 지속적으로 검증
- 사용자보다 먼저 문제를 발견하고 해결할 수 있음
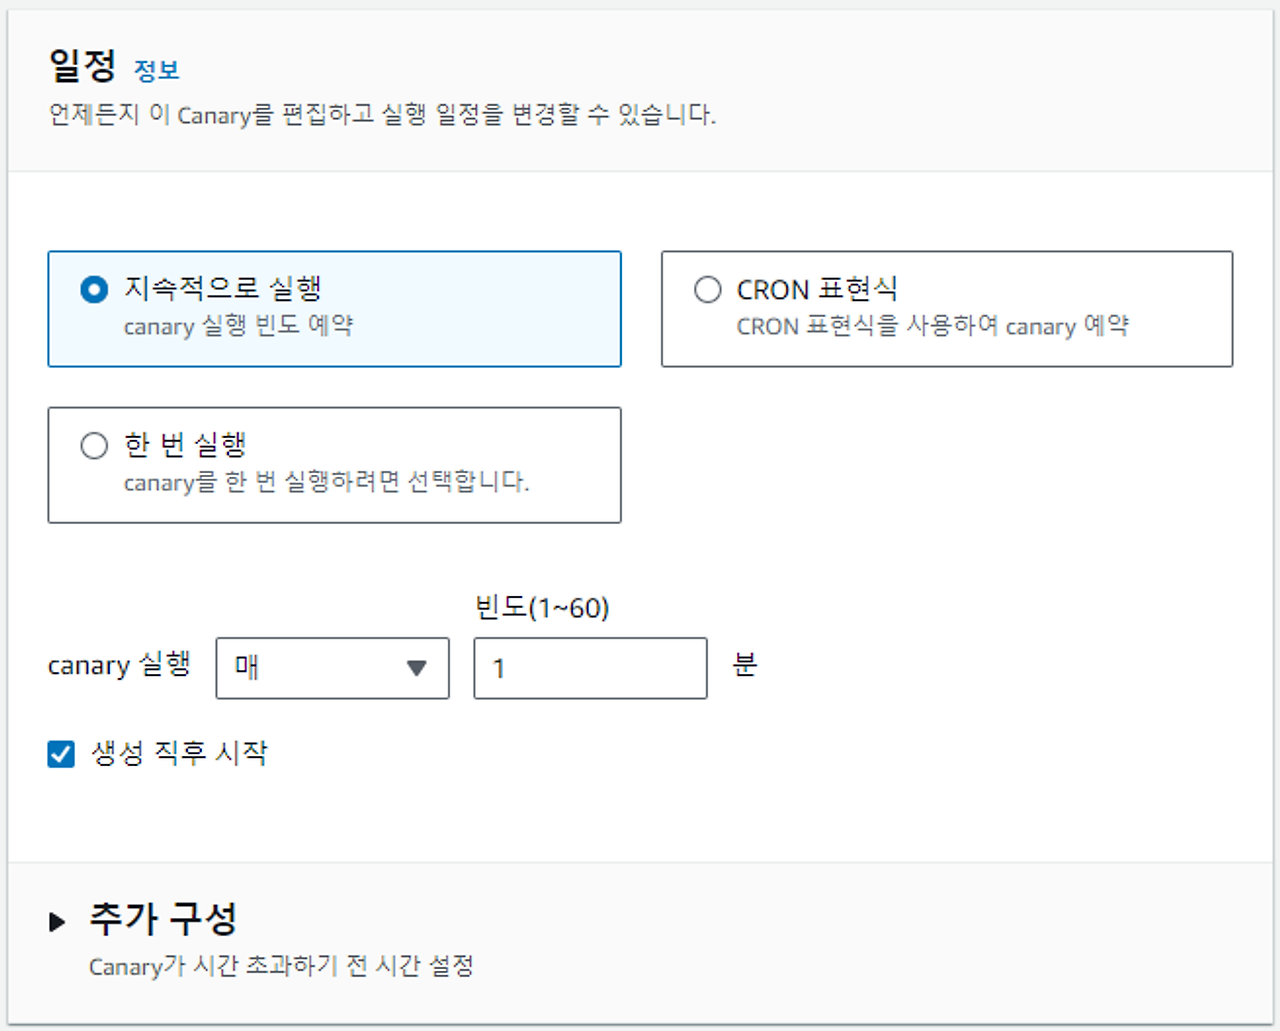
- Amazon CloudWatch Synthetics를 사용하면 카나리아(canaries)를 생성하여 웹 애플리케이션의 엔드포인트와 API를 주기적으로 모니터링할 수 있음


⚠️주의 - 단계이름 반드시 앞 ‘확인’부분 지우기


실패 case
serverless-observability-workshop/code/sample-app-tracing/src/handlers/get-all-items.js
if (event.httpMethod !== 'GET') {
    throw new Error(`getAllItems only accept GET method, you tried: ${event.httpMethod}`)
}
throw new Error('Sample exception introduction') // <- Sample exception throw
편집 후 재 배포
cd ~/environment/serverless-observability-workshop/code/sample-app
sam build && sam deploy
(삭제) throw new Error('Sample exception introduction') // <- Sample exception throw편집 후 재 배포
cd ~/environment/serverless-observability-workshop/code/sample-app
sam build && sam deploy

다시 정상으로 돌아온 것을 확인 가능
'Cloud > AWS' 카테고리의 다른 글
| AWS Security 정리 (0) | 2024.01.31 |
|---|