데이터 수집 아키텍처
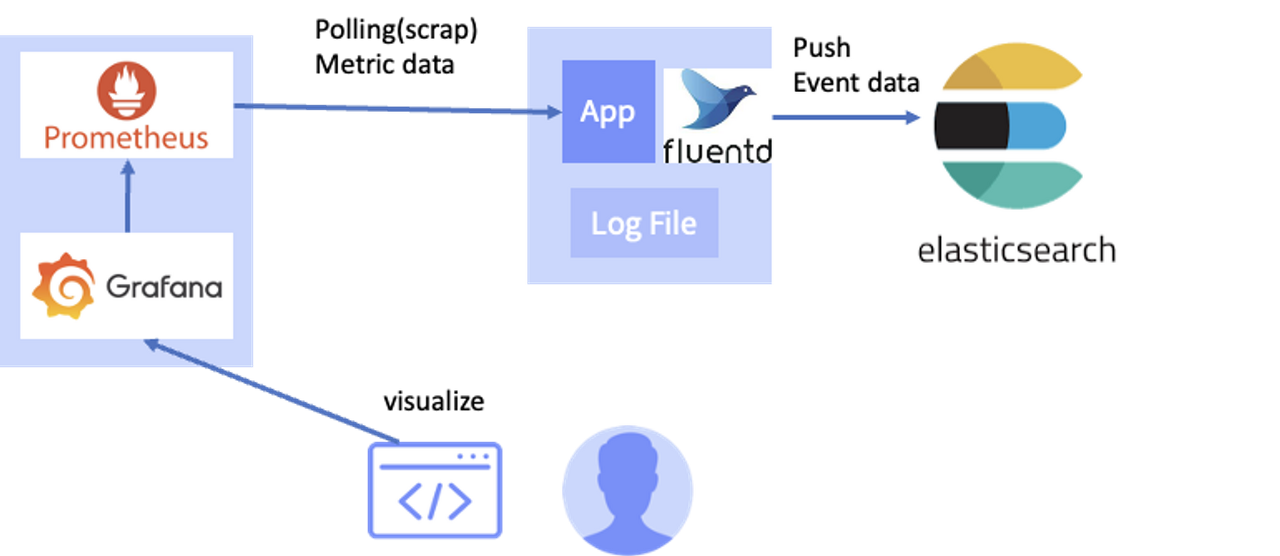
위의 구조를 목표로 이번에는 Prometheus로 데이터 polling하고 Grafana로 시각화 하는 것을 목표로 하였다.
Prometheus
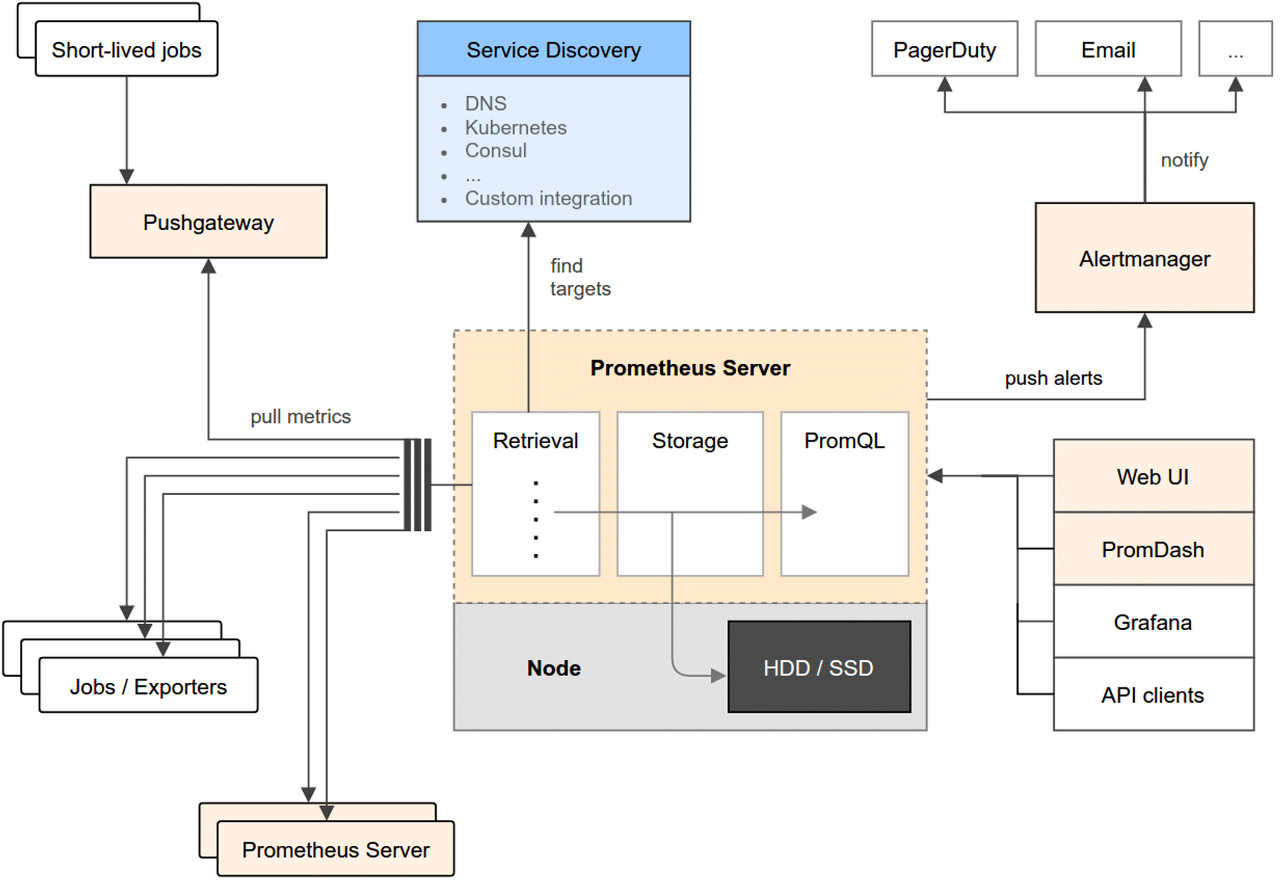
Prometheus 아키텍처이다.
Prometheus Server
Metric을 여러 노드에서 scraping(polling) 방식으로 수집하고 Local storage에 저장한다.
Metric 대상은 static하게 설정해서 IP:Port 로 찾을 수도 있고, Sevice Discovery 도구와 연동하면 dynamic하게 대상을 찾을 수 있다.
Push Gateway
scrap 대상으로 지정할 수 없는 경우 직접 Push할 수 있는 기능이다.
Push된 metric은 pushgateway가 보관하고 prometheus는 pushgateway를 scrap해서 가져온다.
Alert Manager
Alert에 대한 정보를 관리한다.
조건을 충족하면 alert를 보낸다.
PromQL
Prometheus metric에 대한 집계와 변환 작업을 수행하는 쿼리이다.
이 부분은 메뉴얼을 찾아보며 사용하는 것을 권장한다.
https://prometheus.io/docs/prometheus/latest/querying/basics/
Querying basics | Prometheus
An open-source monitoring system with a dimensional data model, flexible query language, efficient time series database and modern alerting approach.
prometheus.io
Prometheus 한계
데이터를 local storage에 저장하고 해당 데이털르 색인한다. 그리고 클러스터를 구성할 수 있는 아키텍처도 아니다.
시간이 지나면 휘발되는 TTL 기반의 데이터이기 때문에 대용량 데이터는 안된다.
그래서 확장성 있는 저장소와 아키텍처 적용이 필요하다.
이를 위해 Thanos를 많이 사용한다.
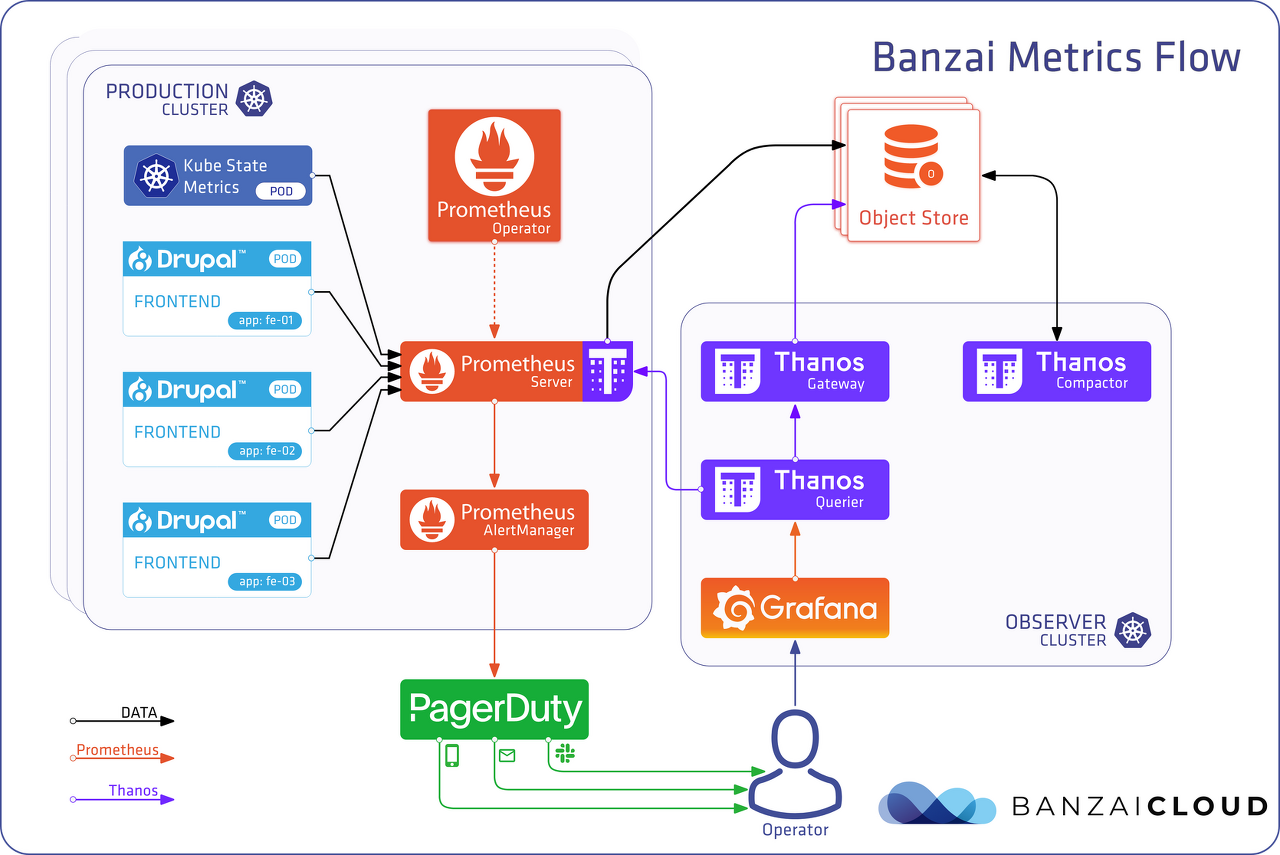
Thanos에게 데이터 저장, 관리, 조회를 위임하고 Prometheus를 데이터 polling만 한다.
이런 구조로 구성하면 long-term 데이터와 최신 데이터 모두 조회할 수 있다.
Prometheus 설치
ec2 서버에 prometheus를 설치한다.
wget https://github.com/prometheus/prometheus/releases/download/v2.40.6/prometheus-2.40.6.linux-amd64.tar.gz

tar xvfz prometheus-*.tar.gz
mv prometheus-2.40.6.linux-amd64 prometheus
cd prometheus
export PROMETHEUS_HOME=$(pwd)
실행
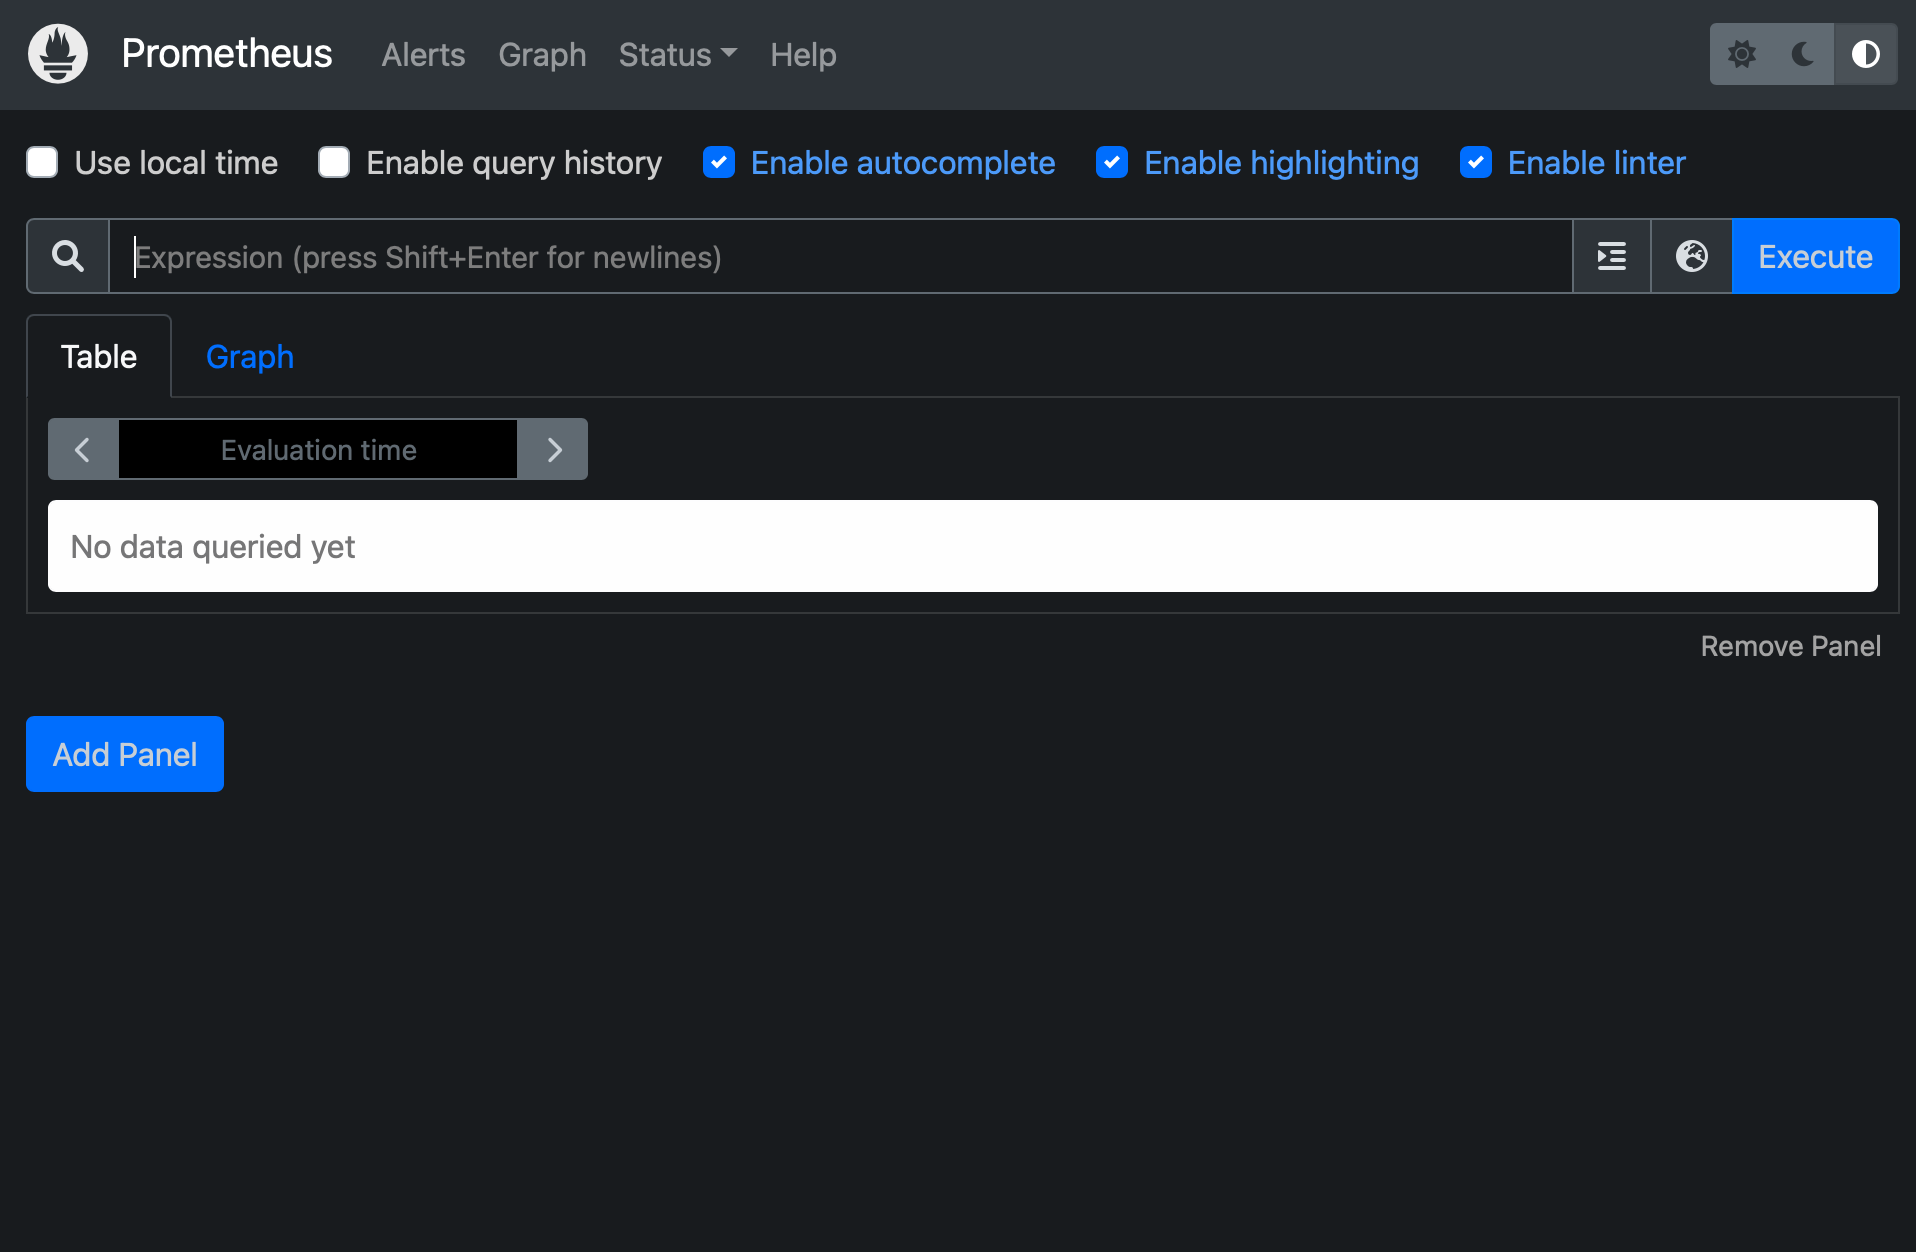
./prometheus --config.file=prometheus.yml웹 브라우서에서 ec2 서버IP:9090으로 접속하면
prometheus GUI를 확인할 수 있다.
ec2 서버IP:9090/metrics 로 들어가면 raw한 데이터도 볼 수 있다.
잘 동작하는 것을 확인했으면 systemctl로 등록한다.
sudo vi /etc/systemd/system/prometheus.service여기서 아래 내용으로 수정한다.
[Unit]
Description=Prometheus Server
Documentation=https://prometheus.io/docs/introduction/overview/
Wants=network-online.target
After=network-online.target

[Service]
User=ubuntu
Group=ubuntu
Restart=on-failure

WorkingDirectory=

ExecStart=/home/ubuntu/prometheus/prometheus \
  --config.file=/home/ubuntu/prometheus/prometheus.yml \
  --web.console.templates=/home/ubuntu/prometheus/consoles \
  --web.console.libraries=/home/ubuntu/prometheus/console_libraries \
  --web.enable-admin-api

[Install]
WantedBy=multi-user.target
:wq로 저장하고 나온다.
sudo systemctl daemon-reload
sudo systemctl enable prometheus.service
sudo systemctl start prometheus.service
등록하고
ps -ef | grep prometheus 커맨드로 확인해본다.
Prometheus Push gateway 설치
cd ~/
wget https://github.com/prometheus/pushgateway/releases/download/v1.5.1/pushgateway-1.5.1.linux-amd64.tar.gz

tar xvfz pushgateway-*.tar.gz
mv pushgateway-1.5.1.linux-amd64 pushgateway

cd pushgateway
./pushgateway
이번에는 9091포트로 웹브라우저에서 확인한다.
publicIp주소:9091
여기서도 /metrics를 붙여서 확인할 수 있다.
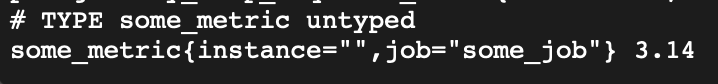
내 컴퓨터에서 아래 명령어로 임시 데이터를 전송해본다.
중간에 $YOUT_IP를 자신의 ec2서버 ip주소로 바꿔준다.
echo "some_metric 3.14" | curl -XPOST --data-binary @- http://$YOUR_IP:9091/metrics/job/some_job웹브라우저(/metrics)에서 데이터 받은 것을 확인할 수 있다.
이것도 systemctl로 등록한다.
sudo vi /etc/systemd/system/pushgateway.service[Unit]
Description=Pushgateway
Wants=network-online.target
After=network-online.target
[Service]
User=ubuntu
Group=ubuntu
Type=simple
ExecStart=/home/ubuntu/pushgateway/pushgateway \
--web.listen-address=":9091" \
--web.telemetry-path="/metrics" \
--persistence.file="/home/ubuntu/pushgateway/metric.store" \
--persistence.interval=5m \
--log.level="info" \
[Install]
WantedBy=multi-user.targetsudo systemctl daemon-reload
sudo systemctl enable pushgateway.service
sudo systemctl start pushgateway.service이번에도 ps -ef | grep pushgateway 로 확인한다.
Prometheus에서 Pushgateway를 scrap
$PROMETHEUS_HOME/prometheus.yml 를 수정해서 pushgateway의 데이터를 scrap 할 수 있다.
- scrap_configs: 하위에 다음 내용을 추가.
- $YOUR_PUSHGATEWAY_IP_OR_DNS 에 pushgateway 를 설치한 IP 나 DNS이름을 넣는다.
  - job_name: 'pushgateway'
    honor_labels: true
    static_configs:
      - targets: ['$YOUR_PUSHGATEWAY_IP_OR_DNS:9091']
2. systemctl 을 통해 prometheus 를 재기동한다.
3. prometheus 서버의 graph 에서 some_metric 이 조회되는지 확인한다.
'Data Engineering > Observability' 카테고리의 다른 글
| [Prometheus] - CentOS에서 모니터링 & Pushgateway & AlertManager 구축 해보기!(이론) (0) | 2024.02.12 |
|---|---|
| [Observability] - 5. 자신의 Application Monitoring 해보기!! (1) | 2024.01.01 |
| [Observability] - 4. Node Monitoring 해보기!! (0) | 2024.01.01 |
| [Observability] - 3. Grafana로 대시보드 구성하고 메일로 Alert 받기 (0) | 2023.12.30 |
| [Observability] - 1. Observability란 & 도구 (0) | 2023.12.29 |