[Prometheus] - CentOS에서 모니터링 & Pushgateway & AlertManager 구축 해보기!(이론)
Prometheus 모니터링을 위한 오픈소스 시스템으로 주로 "Metric" 정보를 수집하기 위한 용도로 사용된다. 다양한 시스템의 상태를 쉽게 확인 및 분석할 수 있다. 특정 rule을 위배하는 트리거가 발생하
cstory-bo.tistory.com
위의 이론내용을 바탕으로
아래와 같은 구조로 프로젝트를 진행해보았다.

CentOS VM Server 3대로 구성
- Node exporter
- server 1: http://192.168.0.151:9100/
- server 2: http://192.168.0.152:9100/
- server 3: http://192.168.0.153:9100/
- Prometheus
- server 3: http://192.168.0.153:9090/graph
- Grafana
- server 3: http://192.168.0.153:3000/
- 로그인 필요할 경우 admin/admin
- 비밀번호 변경 창에서는 왼쪽 아래 skip
- Pushgateway
- server 2: http://192.168.0.152:9091/
Prometheus
1. prometheus 설치
wget <https://github.com/prometheus/prometheus/releases/download/v2.21.0/prometheus-2.21.0.linux-amd64.tar.gz>
tar -xzvf prometheus-2.21.0.linux-amd64.tar.gz
mv prometheus-2.21.0.linux-amd64 prometheus
cd prometheus/
2. 방화벽 설정
9090 포트 열기
firewall-cmd --add-port=9090/tcp --permanent --zone=public
firewall-cmd --reload
firewall-cmd --list-all
3. 웹페이지 뜨는 지 확인

4. 시스템 등록
vi /etc/systemd/system/prometheus.service
[Unit]
Description=Prometheus Server
Documentation=https://prometheus.io/docs/introduction/overview/
Wants=network-online.target
After=network-online.target

[Service]
User=root

Restart=on-failure
ExecStart=/root/prometheus/prometheus \\
  --config.file=/root/prometheus/prometheus.yml \\
  --storage.tsdb.path=/root/prometheus/data \\
  --storage.tsdb.retention=30d \\
  --web.console.templates=/root/prometheus/consoles \\
  --web.console.libraries=/root/prometheus/console_libraries \\
  --web.enable-admin-api

[Install]
WantedBy=multi-user.target
prometheus 설치한 유저(User)와 그룹(Group)으로 위에서 변경한다.
설치한 파일들의 PATH도 변경한다.
storage tsdb 설정에서 저장 위치와 30일까지 저장을 설정하였다.
Web console은 이후 해당 폴더에서 웹 페이지를 구성할 수 있다. 현재 시나리오에서는 제거해도 된다.
systemctl daemon-reload
systemctl start prometheus.service
systemctl enable prometheus.service
systemctl status prometheus.service
Node exporter
1. 설치
wget https://github.com/prometheus/node_exporter/releases/download/v1.0.1/node_exporter-1.0.1.linux-amd64.tar.gz
tar -xzvf node_exporter-1.0.1.linux-amd64.tar.gz
mv node_exporter-1.0.1.linux-amd64/ node_exporter
2. 방화벽 설정
firewall-cmd --add-port=9100/tcp --permanent --zone=public
firewall-cmd --reload
firewall-cmd --list-all
3. 웹으로 확인
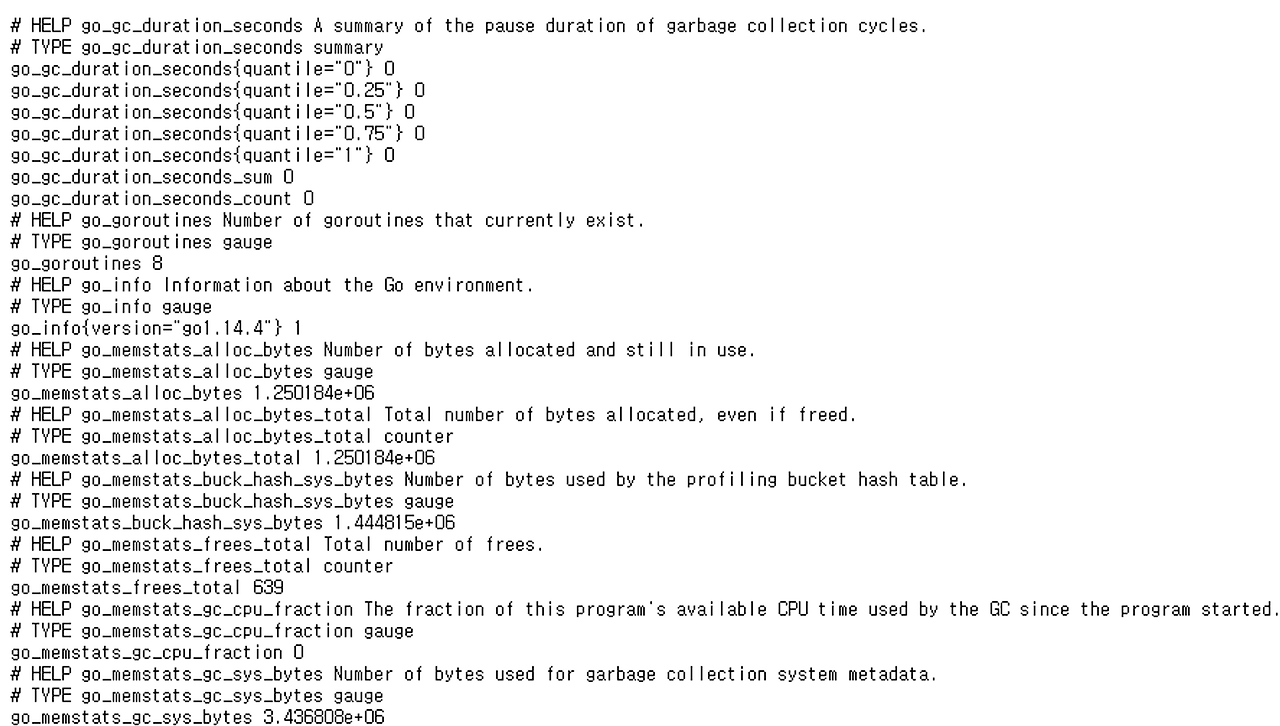
http://localhost:9100/metrics

4. 시스템 등록
sudo vi /etc/systemd/system/node_exporter.service
[Unit]
Description=Prometheus Node Exporter
Documentation=https://prometheus.io/docs/guides/node-exporter/
Wants=network-online.target
After=network-online.target

[Service]
User=root
Restart=on-failure
ExecStart=/root/node_exporter/node_exporter

[Install]
WantedBy=multi-user.target
systemctl daemon-reload
systemctl start node_exporter
systemctl status node_exporter
systemctl enable node_exporter
Prometheus와 Node exporter 연동
1. Prometheus 설정
vi /root/prometheus/prometheus.yml
밑에 job 추가
node라는 이름으로 job을 추가하였다.(이후 grafana에서 template을 쓰려면 node로 job name을 줘야한다.)
그리고 node exporter를 설치한 노드들의 ip와 포트를 제공한다.
# my global config
global:
  scrape_interval:     15s # Set the scrape interval to every 15 seconds. Default is every 1 minute.
  evaluation_interval: 15s # Evaluate rules every 15 seconds. The default is every 1 minute.
  # scrape_timeout is set to the global default (10s).

# Alertmanager configuration
alerting:
  alertmanagers:
  - static_configs:
    - targets:
      # - alertmanager:9093

# Load rules once and periodically evaluate them according to the global 'evaluation_interval'.
rule_files:
  # - "first_rules.yml"
  # - "second_rules.yml"

# A scrape configuration containing exactly one endpoint to scrape:
# Here it's Prometheus itself.
scrape_configs:
  # The job name is added as a label `job=<job_name>` to any timeseries scraped from this config.
  - job_name: 'prometheus'

    # metrics_path defaults to '/metrics'
    # scheme defaults to 'http'.

    static_configs:
    - targets: ['localhost:9090']

  - job_name: 'node'
    static_configs:
    - targets: ['192.168.0.151:9100','192.168.0.152:9100','192.168.0.153:9100']
2. 시스템 재시작
systemctl restart prometheus
systemctl status prometheus
3. Prometheus에서 메트리 수집 되는지 확인
proemtheusIP:9090 으로 웹에서 확인

Grafana
1. 설치
다른 서버도 가능하지만 아래에서는 prometheus 설치한 서버에서 진행
yum install -y <https://dl.grafana.com/oss/release/grafana-9.1.1-1.x86_64.rpm>2. 방화벽 설정
방화벽 3000포트 열기
firewall-cmd --permanent --zone=public --add-port=3000/tcp
firewall-cmd --reload
3. 시스템 등록
systemctl daemon-reload
systemctl start grafana-server
systemctl status grafana-server
systemctl enable grafana-server
http://ip:3000
들어가서
admin admin 으로 로그인
4. Grafana에서 Prometheus 등록
Configure > Data sources 에서 prometheus 등록
URL : http://localhost:9090


5. 대시보드 설정
직접 dashboard create에서 PromQL을 작성하여 구성 가능
템플릿을 가져와 사용할 수도 있다.
https://grafana.com/grafana/dashboards/1860-node-exporter-full/
위에서 json 파일이나 ID 가져와서
대시보드 > create > import 추가
(Host에 ip는 보이지만 값이 안 보인다면 조금 기다리면 보일 수도 있다.)

Pushgateway 추가
1. pushgateway 설치
참고 링크 : https://prometheus.io/download/#pushgateway
wget <https://github.com/prometheus/pushgateway/releases/download/v1.7.0/pushgateway-1.7.0.linux-amd64.tar.gz>압축 해제
tar xvzf pushgateway-1.7.0.linux-amd64.tar.gz
mv pushgateway-1.7.0.linux-amd64 pushgateway
2. 시스템 등록
vi /etc/systemd/system/pushgateway.service
[Unit]
Description=Pushgateway
Wants=network-online.target
After=network-online.target

[Service]
User=root
Type=simple
ExecStart=/root/pushgateway/pushgateway

[Install]
WantedBy=multi-user.target- ExecStart - pushgateway 실행파일 절대경로
systemctl daemon-reload
systemctl enable pushgateway
systemctl start pushgateway
systemctl status pushgateway
3. prometheus에 pushgateway 연결
다시 Prometheus 설치했던 서버로 돌아온다.
vi /root/prometheus/prometheus.yml
scrape_configs > job_name이 pushgateway 등록
# my global config
global:
  scrape_interval: 5s # Set the scrape interval to every 15 seconds. Default is every 1 minute.
  evaluation_interval: 5s # Evaluate rules every 15 seconds. The default is every 1 minute.
  # scrape_timeout is set to the global default (10s).

# Alertmanager configuration
alerting:
  alertmanagers:
  - static_configs:
    - targets:
      # - alertmanager:9093

# Load rules once and periodically evaluate them according to the global 'evaluation_interval'.
rule_files:
  # - "first_rules.yml"
  # - "second_rules.yml"

# A scrape configuration containing exactly one endpoint to scrape:
# Here it's Prometheus itself.
scrape_configs:
  # The job name is added as a label `job=<job_name>` to any timeseries scraped from this config.
  - job_name: 'prometheus'
    # metrics_path defaults to '/metrics'
    # scheme defaults to 'http'.
    static_configs:
    - targets: ['192.168.0.153:9090']

  - job_name: 'node'
    static_configs:
    - targets: ['192.168.0.151:9100','192.168.0.152:9100','192.168.0.153:9100']

  - job_name: 'pushgateway'
    honor_labels: true
    static_configs:
    - targets: ['192.168.0.152:9091']
4. 재시작
systemctl restart prometheus pushgateway
systemctl status prometheus pushgateway
Alert Manager 추가
1. alert manager 설치
참고 링크 : https://prometheus.io/download/#alertmanager
wget <https://github.com/prometheus/alertmanager/releases/download/v0.26.0/alertmanager-0.26.0.linux-amd64.tar.gz>
압축 해제
tar xvzf alertmanager-0.26.0.linux-amd64.tar.gz
mkdir /etc/alertmanager
cp /root/alertmanager-0.26.0.linux-amd64/* /etc/alertmanager/
rm -rf /root/alertmanager-0.26.0.linux-amd64
2. 시스템 등록
vi /usr/lib/systemd/system/alertmanager.service
[Unit]
Description=Alert Manager
Wants=network-online.target
After=network-online.target

[Service]
User=root
Group=root
Type=simple
ExecStart=/etc/alertmanager/alertmanager --config.file=/etc/alertmanager/alertmanager.yml

[Install]
WantedBy=multi-user.target
systemctl daemon-reload
systemctl enable alertmanager
systemctl start alertmanager
3. slack api url 구하기
Slack에 들어가서 새 워크스페이스 생성
워크스페이스 안 채널을 생성했다면, 채널 위에서 우클릭 후 채널 세부정보 보기 클릭

통합 > 앱추가

webhook 검색하고 앱 설치

Slack에 추가 누르고 채널 지정
이때 클릭했을 때 안뜬다면, 직접 검색

수신 웹후크 통합 앱 추가 > 저장 누른 후 URL 복사
아래 설정에 추가
4. alert manager 설정
vi /etc/alertmanager/alertmanager.yml
global:
  slack_api_url: "<https://hooks.slack.com/services/XXX>"

route:
  group_by: ['node_exporter_alerts']
  receiver: 'slack-notifications'
  repeat_interval: 2m
receivers:
  - name: 'slack-notifications'
    slack_configs:
      - channel: '#monitoring'
        send_resolved: true
        username: "Prometheus"
        title: "{{ range .Alerts }}{{ .Annotations.summary }}\\n{{ end }}"
text: "{{ range .Alerts }}{{ .Annotations.description }}\\n{{ end }}"- slack_api_url → 이 부분은 위에서 구한 url로 수정
- channel → 자신의 채널 명 입력, 앞에 # 붙이기
- 여기서 넣은 title과 text 내용을 slack 알람이 온다.
5. 시스템 재시작
systemctl restart alertmanager
systemctl status alertmanager
6. Prometheus 설정 파일 수정
vi /root/prometheus/prometheus.yml
alerting과 rule_files에 추가
# my global config
global:
  scrape_interval: 5s # Set the scrape interval to every 15 seconds. Default is every 1 minute.
  evaluation_interval: 5s # Evaluate rules every 15 seconds. The default is every 1 minute.
  # scrape_timeout is set to the global default (10s).

# Alertmanager configuration
alerting:
  alertmanagers:
  - scheme: http
    static_configs:
    - targets:
      - '192.168.0.153:9093'

# Load rules once and periodically evaluate them according to the global 'evaluation_interval'.
rule_files:
  - '/root/prometheus/rules.yml'

# A scrape configuration containing exactly one endpoint to scrape:
# Here it's Prometheus itself.
scrape_configs:
  # The job name is added as a label `job=<job_name>` to any timeseries scraped from this config.
  - job_name: 'prometheus'
    # metrics_path defaults to '/metrics'
    # scheme defaults to 'http'.
    static_configs:
    - targets: ['192.168.0.153:9090']

  - job_name: 'node'
    static_configs:
    - targets: ['192.168.0.151:9100','192.168.0.152:9100','192.168.0.153:9100']

  - job_name: 'pushgateway'
    honor_labels: true
    static_configs:
    - targets: ['192.168.0.152:9091']
7. alerting rule 작성
vi /root/prometheus/rules.ymlgroups:
- name: node_exporter_alerts
rules:
- alert: Node down
expr: up{job="monitoring-pi"} == 0
for: 1m
labels:
severity: warning
annotations:
title: Node {{ $labels.instance }} is down
description: Failed to scrape {{ $labels.job }} on {{ $labels.instance }} for more than 2 minutes. Node seems down.
- alert: HostOutOfMemory
expr: node_memory_MemAvailable_bytes / node_memory_MemTotal_bytes * 100 < 10
for: 2m
labels:
severity: warning
annotations:
summary: Host out of memory (instance {{ $labels.instance }})
description: Node memory is filling up (< 10% left)\n VALUE = {{ $value }}
- alert: HostMemoryUnderMemoryPressure
expr: rate(node_vmstat_pgmajfault[1m]) > 1000
for: 2m
labels:
severity: warning
annotations:
summary: Host memory under memory pressure (instance {{ $labels.instance }})
description: The node is under heavy memory pressure. High rate of major page faults\n VALUE = {{ $value }}
- alert: HostUnusualNetworkThroughputIn
expr: sum by (instance) (rate(node_network_receive_bytes_total[2m])) / 1024 / 1024 > 100
for: 5m
labels:
severity: warning
annotations:
summary: Host unusual network throughput in (instance {{ $labels.instance }})
description: Host network interfaces are probably receiving too much data (> 100 MB/s)\n VALUE = {{ $value }}
- alert: HostUnusualNetworkThroughputOut
expr: sum by (instance) (rate(node_network_transmit_bytes_total[2m])) / 1024 / 1024 > 100
for: 5m
labels:
severity: warning
annotations:
summary: Host unusual network throughput out (instance {{ $labels.instance }})
description: Host network interfaces are probably sending too much data (> 100 MB/s)\n VALUE = {{ $value }}
- alert: HostUnusualDiskReadRate
expr: sum by (instance) (rate(node_disk_read_bytes_total[2m])) / 1024 / 1024 > 50
for: 5m
labels:
severity: warning
annotations:
summary: Host unusual disk read rate (instance {{ $labels.instance }})
description: Disk is probably reading too much data (> 50 MB/s)\n VALUE = {{ $value }}
- alert: HostUnusualDiskWriteRate
expr: sum by (instance) (rate(node_disk_written_bytes_total[2m])) / 1024 / 1024 > 50
for: 2m
labels:
severity: warning
annotations:
summary: Host unusual disk write rate (instance {{ $labels.instance }})
description: Disk is probably writing too much data (> 50 MB/s)\n VALUE = {{ $value }}
# Please add ignored mountpoints in node_exporter parameters like
# "--collector.filesystem.ignored-mount-points=^/(sys|proc|dev|run)($|/)".
# Same rule using "node_filesystem_free_bytes" will fire when disk fills for non-root users.
- alert: HostOutOfDiskSpace
expr: (node_filesystem_avail_bytes * 100) / node_filesystem_size_bytes < 10 and ON (instance, device, mountpoint) node_filesystem_readonly == 0
for: 2m
labels:
severity: warning
annotations:
summary: Host out of disk space (instance {{ $labels.instance }})
description: Disk is almost full (< 10% left)\n VALUE = {{ $value }}
# Please add ignored mountpoints in node_exporter parameters like
# "--collector.filesystem.ignored-mount-points=^/(sys|proc|dev|run)($|/)".
# Same rule using "node_filesystem_free_bytes" will fire when disk fills for non-root users.
- alert: HostDiskWillFillIn24Hours
expr: (node_filesystem_avail_bytes * 100) / node_filesystem_size_bytes < 10 and ON (instance, device, mountpoint) predict_linear(node_filesystem_avail_bytes{fstype!~"tmpfs"}[1h], 24 * 3600) < 0 and ON (instance, device, mountpoint) node_filesystem_readonly == 0
for: 2m
labels:
severity: warning
annotations:
summary: Host disk will fill in 24 hours (instance {{ $labels.instance }})
description: Filesystem is predicted to run out of space within the next 24 hours at current write rate\n VALUE = {{ $value }}
- alert: HostOutOfInodes
expr: node_filesystem_files_free{mountpoint ="/rootfs"} / node_filesystem_files{mountpoint="/rootfs"} * 100 < 10 and ON (instance, device, mountpoint) node_filesystem_readonly{mountpoint="/rootfs"} == 0
for: 2m
labels:
severity: warning
annotations:
summary: Host out of inodes (instance {{ $labels.instance }})
description: Disk is almost running out of available inodes (< 10% left)\n VALUE = {{ $value }}
- alert: HostInodesWillFillIn24Hours
expr: node_filesystem_files_free{mountpoint ="/rootfs"} / node_filesystem_files{mountpoint="/rootfs"} * 100 < 10 and predict_linear(node_filesystem_files_free{mountpoint="/rootfs"}[1h], 24 * 3600) < 0 and ON (instance, device, mountpoint) node_filesystem_readonly{mountpoint="/rootfs"} == 0
for: 2m
labels:
severity: warning
annotations:
summary: Host inodes will fill in 24 hours (instance {{ $labels.instance }})
description: Filesystem is predicted to run out of inodes within the next 24 hours at current write rate\n VALUE = {{ $value }}
- alert: HostUnusualDiskReadLatency
expr: rate(node_disk_read_time_seconds_total[1m]) / rate(node_disk_reads_completed_total[1m]) > 0.1 and rate(node_disk_reads_completed_total[1m]) > 0
for: 2m
labels:
severity: warning
annotations:
summary: Host unusual disk read latency (instance {{ $labels.instance }})
description: Disk latency is growing (read operations > 100ms)\n VALUE = {{ $value }}
- alert: HostUnusualDiskWriteLatency
expr: rate(node_disk_write_time_seconds_totali{device!~"mmcblk.+"}[1m]) / rate(node_disk_writes_completed_total{device!~"mmcblk.+"}[1m]) > 0.1 and rate(node_disk_writes_completed_total{device!~"mmcblk.+"}[1m]) > 0
for: 2m
labels:
severity: warning
annotations:
summary: Host unusual disk write latency (instance {{ $labels.instance }})
description: Disk latency is growing (write operations > 100ms)\n VALUE = {{ $value }}
- alert: HostHighCpuLoad
expr: 100 - (avg by(instance) (rate(node_cpu_seconds_total{mode="idle"}[2m])) * 100) > 80
for: 0m
labels:
severity: warning
annotations:
summary: Host high CPU load (instance {{ $labels.instance }})
description: CPU load is > 80%\n VALUE = {{ $value }}
- alert: HostCpuStealNoisyNeighbor
expr: avg by(instance) (rate(node_cpu_seconds_total{mode="steal"}[5m])) * 100 > 10
for: 0m
labels:
severity: warning
annotations:
summary: Host CPU steal noisy neighbor (instance {{ $labels.instance }})
description: CPU steal is > 10%. A noisy neighbor is killing VM performances or a spot instance may be out of credit.\n VALUE = {{ $value }}
# 1000 context switches is an arbitrary number.
# Alert threshold depends on nature of application.
# Please read: https://github.com/samber/awesome-prometheus-alerts/issues/58
- alert: HostContextSwitching
expr: (rate(node_context_switches_total[5m])) / (count without(cpu, mode) (node_cpu_seconds_total{mode="idle"})) > 1000
for: 0m
labels:
severity: warning
annotations:
summary: Host context switching (instance {{ $labels.instance }})
description: Context switching is growing on node (> 1000 / s)\n VALUE = {{ $value }}
- alert: HostSwapIsFillingUp
expr: (1 - (node_memory_SwapFree_bytes / node_memory_SwapTotal_bytes)) * 100 > 80
for: 2m
labels:
severity: warning
annotations:
summary: Host swap is filling up (instance {{ $labels.instance }})
description: Swap is filling up (>80%)\n VALUE = {{ $value }}
- alert: HostSystemdServiceCrashed
expr: node_systemd_unit_state{state="failed"} == 1
for: 0m
labels:
severity: warning
annotations:
summary: Host SystemD service crashed (instance {{ $labels.instance }})
description: SystemD service crashed\n VALUE = {{ $value }}
- alert: HostPhysicalComponentTooHot
expr: node_hwmon_temp_celsius > 75
for: 5m
labels:
severity: warning
annotations:
summary: Host physical component too hot (instance {{ $labels.instance }})
description: Physical hardware component too hot\n VALUE = {{ $value }}
- alert: HostNodeOvertemperatureAlarm
expr: node_hwmon_temp_crit_alarm_celsius == 1
for: 0m
labels:
severity: critical
annotations:
summary: Host node overtemperature alarm (instance {{ $labels.instance }})
description: Physical node temperature alarm triggered\n VALUE = {{ $value }}
- alert: HostRaidArrayGotInactive
expr: node_md_state{state="inactive"} > 0
for: 0m
labels:
severity: critical
annotations:
summary: Host RAID array got inactive (instance {{ $labels.instance }})
description: RAID array {{ $labels.device }} is in degraded state due to one or more disks failures. Number of spare drives is insufficient to fix issue automatically.\n VALUE = {{ $value }}
- alert: HostRaidDiskFailure
expr: node_md_disks{state="failed"} > 0
for: 2m
labels:
severity: warning
annotations:
summary: Host RAID disk failure (instance {{ $labels.instance }})
description: At least one device in RAID array on {{ $labels.instance }} failed. Array {{ $labels.md_device }} needs attention and possibly a disk swap\n VALUE = {{ $value }}
- alert: HostKernelVersionDeviations
expr: count(sum(label_replace(node_uname_info, "kernel", "$1", "release", "([0-9]+.[0-9]+.[0-9]+).*")) by (kernel)) > 1
for: 6h
labels:
severity: warning
annotations:
summary: Host kernel version deviations (instance {{ $labels.instance }})
description: Different kernel versions are running\n VALUE = {{ $value }}
- alert: HostOomKillDetected
expr: increase(node_vmstat_oom_kill[1m]) > 0
for: 0m
labels:
severity: warning
annotations:
summary: Host OOM kill detected (instance {{ $labels.instance }})
description: OOM kill detected\n VALUE = {{ $value }}
- alert: HostEdacCorrectableErrorsDetected
expr: increase(node_edac_correctable_errors_total[1m]) > 0
for: 0m
labels:
severity: info
annotations:
summary: Host EDAC Correctable Errors detected (instance {{ $labels.instance }})
description: Instance has had {{ printf "%.0f" $value }} correctable memory errors reported by EDAC in the last 5 minutes.\n VALUE = {{ $value }}
- alert: HostEdacUncorrectableErrorsDetected
expr: node_edac_uncorrectable_errors_total > 0
for: 0m
labels:
severity: warning
annotations:
summary: Host EDAC Uncorrectable Errors detected (instance {{ $labels.instance }})
description: Instance has had {{ printf "%.0f" $value }} uncorrectable memory errors reported by EDAC in the last 5 minutes.\n VALUE = {{ $value }}
- alert: HostNetworkReceiveErrors
expr: rate(node_network_receive_errs_total[2m]) / rate(node_network_receive_packets_total[2m]) > 0.01
for: 2m
labels:
severity: warning
annotations:
summary: Host Network Receive Errors (instance {{ $labels.instance }}:{{ $labels.device }})
description: Instance interface has encountered {{ printf "%.0f" $value }} receive errors in the last five minutes.\n VALUE = {{ $value }}
- alert: HostNetworkTransmitErrors
expr: rate(node_network_transmit_errs_total[2m]) / rate(node_network_transmit_packets_total[2m]) > 0.01
for: 2m
labels:
severity: warning
annotations:
summary: Host Network Transmit Errors (instance {{ $labels.instance }}:{{ $labels.device }})
description: Instance has encountered {{ printf "%.0f" $value }} transmit errors in the last five minutes.\n VALUE = {{ $value }}
- alert: HostNetworkInterfaceSaturated
expr: (rate(node_network_receive_bytes_total{device!~"^tap.*"}[1m]) + rate(node_network_transmit_bytes_total{device!~"^tap.*"}[1m])) / node_network_speed_bytes{device!~"^tap.*"} > 0.8
for: 1m
labels:
severity: warning
annotations:
summary: Host Network Interface Saturated (instance {{ $labels.instance }}:{{ $labels.interface }})
description: The network interface is getting overloaded.\n VALUE = {{ $value }}
- alert: HostConntrackLimit
expr: node_nf_conntrack_entries / node_nf_conntrack_entries_limit > 0.8
for: 5m
labels:
severity: warning
annotations:
summary: Host conntrack limit (instance {{ $labels.instance }})
description: The number of conntrack is approching limit\n VALUE = {{ $value }}
- alert: HostClockSkew
expr: (node_timex_offset_seconds > 0.05 and deriv(node_timex_offset_seconds[5m]) >= 0) or (node_timex_offset_seconds < -0.05 and deriv(node_timex_offset_seconds[5m]) <= 0)
for: 2m
labels:
severity: warning
annotations:
summary: Host clock skew (instance {{ $labels.instance }})
description: Clock skew detected. Clock is out of sync.\n VALUE = {{ $value }}
8. 재시작
systemctl restart prometheus alertmanager
systemctl status prometheus alertmanager
9. 방화벽 해제
firewall-cmd --permanent --zone=public --add-port=9093/tcp
firewall-cmd --reload
10. Alertmanager 웹 페이지에서 확인

이후 포스팅에서 위에서 구축한 프로젝트에 대한 추가적인 설명과 테스트 해볼 예정이다.
'Data Engineering > Observability' 카테고리의 다른 글
| [Prometheus] - CentOS에서 모니터링 & Pushgateway & AlertManager 구축 해보기!(시연 및 추가정보) (1) | 2024.02.12 |
|---|---|
| [Prometheus] - CentOS에서 모니터링 & Pushgateway & AlertManager 구축 해보기!(이론) (0) | 2024.02.12 |
| [Observability] - 5. 자신의 Application Monitoring 해보기!! (1) | 2024.01.01 |
| [Observability] - 4. Node Monitoring 해보기!! (0) | 2024.01.01 |
| [Observability] - 3. Grafana로 대시보드 구성하고 메일로 Alert 받기 (0) | 2023.12.30 |